Polar Plot - QwtPolarPlot
QwtPolarPlot is a widget for drawing polar coordinate graphics. Unlike the traditional Cartesian coordinate system QwtPlot, it uses angle and radius as its two axes, making it suitable for displaying circular data such as radar charts, directional distributions, and astronomical data.
Main Features
Features
- ✅ Polar coordinate system: Uses angle (0-360°) and radius as axes
- ✅ Curve drawing: Supports drawing curves in polar coordinate system
- ✅ Grid system: Provides concentric circle and angular ray grids
- ✅ Interaction support: Supports zooming and panning in polar coordinate system
Basic Concepts
Polar Coordinate Structure
 1
 2
 3
 4
 5
 6
 7
 8
 9
10
11
12
13
14
15
16
17 | 90°
│
135° │ 45°
\ │ /
\ │ /
\ │ /
180°───●─+─●───0°
/ │ \
/ │ \
/ │ \
225° │ 315°
│
270°
● = Data points
Concentric circles = Radius scales
Rays = Angle scales
|
Polar Item Types
| Class Name |
Description |
QwtPolarPlot |
Main polar plot widget |
QwtPolarCurve |
Polar curve |
QwtPolarGrid |
Polar grid |
QwtPolarMarker |
Polar marker |
Usage
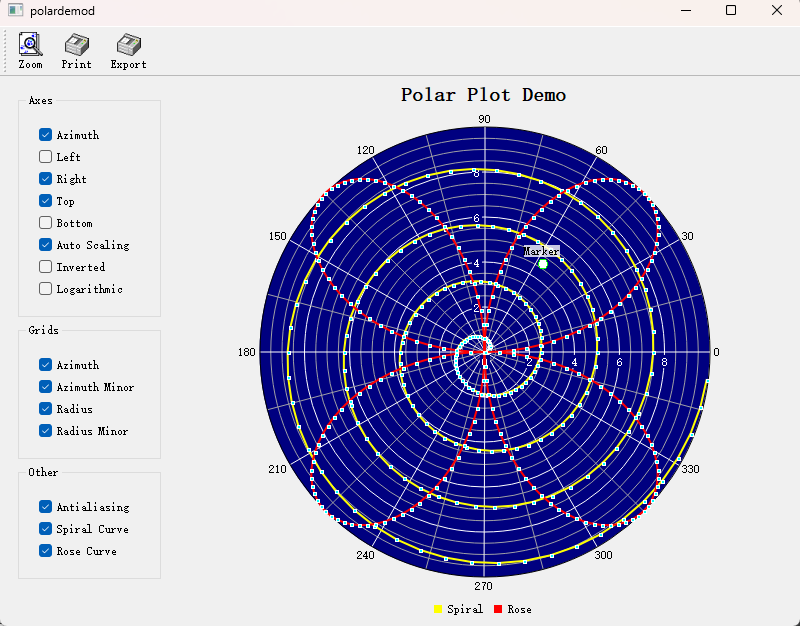
The polar plot example is located at: examples/2D/polardemo. Screenshot:
1. Creating a Polar Plot
 1
 2
 3
 4
 5
 6
 7
 8
 9
10
11
12
13
14
15
16
17
18
19
20
21
22
23
24
25
26
27
28
29
30
31
32
33 | #include <QwtPolarPlot>
#include <QwtPolarGrid>
#include <QwtPolarCurve>
// Create polar plot
QwtPolarPlot* polarPlot = new QwtPolarPlot();
polarPlot->setTitle("Polar Plot Example");
// Set angle range (default 0-360 degrees)
polarPlot->setScale(QwtPolar::Azimuth, 0.0, 360.0);
// Set radius range
polarPlot->setScale(QwtPolar::Radius, 0.0, 100.0);
// Create polar grid
QwtPolarGrid* grid = new QwtPolarGrid();
grid->setPen(QPen(Qt::gray, 0.5));
grid->attach(polarPlot);
// Create polar curve
QwtPolarCurve* curve = new QwtPolarCurve("Curve Data");
// Prepare data (angle, radius)
QVector<QwtPointPolar> samples;
for (int angle = 0; angle < 360; angle += 10) {
double radius = 50 + 30 * std::sin(angle * 3.0 * M_PI / 180.0);
samples << QwtPointPolar(angle, radius);
}
curve->setSamples(samples);
curve->setPen(QPen(Qt::blue, 2));
curve->attach(polarPlot);
polarPlot->replot();
|
2. Polar Grid Configuration
 1
 2
 3
 4
 5
 6
 7
 8
 9
10
11
12
13
14
15
16
17 | QwtPolarGrid* grid = new QwtPolarGrid();
// Show angle grid lines (rays)
grid->showGrid(QwtPolarGrid::Azimuth, true);
// Show radius grid lines (concentric circles)
grid->showGrid(QwtPolarGrid::Radius, true);
// Set grid style
grid->setPen(QPen(Qt::lightGray, 0.5));
// Show tick labels
grid->showAxis(QwtPolarGrid::AxisAzimuth, true); // Angle labels
grid->showAxis(QwtPolarGrid::AxisLeft, true); // Left radius labels
grid->showAxis(QwtPolarGrid::AxisRight, true); // Right radius labels
grid->showAxis(QwtPolarGrid::AxisTop, true); // Top radius labels
grid->showAxis(QwtPolarGrid::AxisBottom, true); // Bottom radius labels
|
3. Polar Curve Style
 1
 2
 3
 4
 5
 6
 7
 8
 9
10
11
12
13 | QwtPolarCurve* curve = new QwtPolarCurve();
// Set curve style
curve->setStyle(QwtPolarCurve::Lines); // Line style
// Other styles: NoCurve (no lines), Dots (scatter)
// Set line style
curve->setPen(QPen(Qt::red, 2));
// Set symbol
QwtSymbol* symbol = new QwtSymbol(QwtSymbol::Ellipse,
QBrush(Qt::red), QPen(Qt::darkRed), QSize(5, 5));
curve->setSymbol(symbol);
|
4. Angle Range Settings
| // Set angle range (e.g., show only 0-180 degrees)
polarPlot->setScale(QwtPolar::Azimuth, 0.0, 180.0);
// Set angle step
polarPlot->setScaleMaxMajor(QwtPolar::Azimuth, 8); // 8 major ticks (every 45 degrees)
// Reverse angle direction
polarPlot->setScale(QwtPolar::Azimuth, 360.0, 0.0); // Decreasing from 360 to 0
|
5. Radius Range Settings
| // Set radius range
polarPlot->setScale(QwtPolar::Radius, 0.0, 200.0);
// Set radius ticks
polarPlot->setScaleMaxMajor(QwtPolar::Radius, 5); // 5 major ticks
polarPlot->setScaleMaxMinor(QwtPolar::Radius, 4); // 4 minor ticks per interval
// Logarithmic radius scale
#include <QwtPolarScaleEngine>
polarPlot->setScaleEngine(QwtPolar::Radius, new QwtPolarLogScaleEngine());
|
6. Polar Markers
1
2
3
4
5
6
7
8
9
10
11
12
13
14
15
16
17
18
19 | #include <QwtPolarMarker>
QwtPolarMarker* marker = new QwtPolarMarker();
// Set marker position
marker->setPosition(QwtPointPolar(90.0, 80.0)); // Angle 90°, radius 80
// Set marker symbol
QwtSymbol* symbol = new QwtSymbol(QwtSymbol::Cross,
Qt::NoBrush, QPen(Qt::red, 2), QSize(10, 10));
marker->setSymbol(symbol);
// Set label
QwtText label("Key Point");
label.setColor(Qt::red);
marker->setLabel(label);
marker->setLabelAlignment(Qt::AlignCenter);
marker->attach(polarPlot);
|
Polar Axis Identifiers
| Identifier |
Enum Value |
Description |
| Angle axis |
QwtPolar::Azimuth |
Angle coordinate (0-360°) |
| Radius axis |
QwtPolar::Radius |
Radius coordinate |
Data Point Structure
| // Polar coordinate point
struct QwtPointPolar {
double azimuth; // Angle (in degrees)
double radius; // Radius
// Can convert from Cartesian coordinates
QwtPointPolar(const QPointF& point); // Automatically calculates angle and radius
};
|
Core Method Summary
QwtPolarPlot
| Method |
Description |
setScale() |
Set axis range |
setScaleMaxMajor() |
Set number of major ticks |
setScaleMaxMinor() |
Set number of minor ticks |
setScaleEngine() |
Set scale engine |
replot() |
Refresh plot |
QwtPolarCurve
| Method |
Description |
setSamples() |
Set data |
setStyle() |
Set curve style |
setPen() |
Set line style |
setSymbol() |
Set data point symbol |
Polar Plot Application Scenarios
- Radar displays
- Astronomical data (star charts)
- Directional distribution statistics
- Antenna radiation patterns
Related Examples
- Polar demo:
examples/2D/polardemo
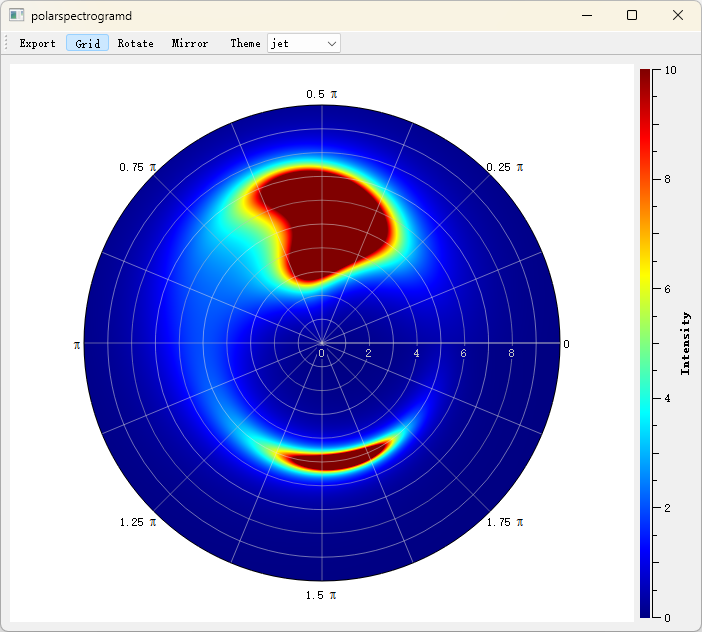
- Polar spectrogram:
examples/2D/polarspectrogram
Screenshot of the polar spectrogram: