Arrow Marker - QwtPlotArrowMarker
QwtPlotArrowMarker is a plot item for drawing arrow annotations on plots. It supports customizable start/end points, head/tail endpoint styles, line styles, and more. It is commonly used for annotating data regions, indicating directions, or adding explanatory notes.
Key Features
- ✅ Two positioning modes: explicit start/end coordinates, or start point + pixel length + angle
- ✅ Seven endpoint styles: NoEndpoint, ArrowHead, Circle, Square, Diamond, Triangle, CustomPath
- ✅ Independent head/tail configuration: each end can have its own style, size, pen, and brush
- ✅ Custom paths: create arbitrary endpoint shapes via
QPainterPath - ✅ Pixel-level control: in
StartLengthAnglemode, arrow size is preserved during zoom
Basic Concepts
Positioning Modes
| Mode | Enum Value | Description |
|---|---|---|
| Explicit coordinates | ExplicitPoints |
Specify start/end in plot coordinates; arrow scales with zoom |
| Start + length + angle | StartLengthAngle |
Specify start point, pixel length, and angle; size is fixed |
Endpoint Style Types
| Style | Enum Value | Description |
|---|---|---|
| None | NoEndpoint |
No endpoint drawn |
| Arrow head | ArrowHead |
V-shaped arrowhead |
| Circle | Circle |
Circular endpoint |
| Square | Square |
Square endpoint |
| Diamond | Diamond |
Diamond-shaped endpoint |
| Triangle | Triangle |
Filled triangle endpoint |
| Custom | CustomPath |
Arbitrary shape via QPainterPath |
Arrow Structure
1 2 3 4 5 | |
Usage
1. Basic Arrow (ExplicitPoints Mode)
Create an arrow with explicit start and end coordinates — the most common approach:
1 2 3 4 5 6 7 8 9 10 11 12 13 14 15 16 17 18 19 20 21 | |
2. Fixed-Length Arrow (StartLengthAngle Mode)
In this mode the arrow length is in pixels and does not change when zooming:
1 2 3 4 5 6 7 8 9 10 11 12 13 14 15 16 17 18 19 20 | |
3. Custom Endpoint Path
Create arbitrary endpoint shapes using QPainterPath, for example a star:
1 2 3 4 5 6 7 8 9 10 11 12 13 14 15 16 17 18 19 20 21 22 23 24 25 26 | |
4. Dual Triangle Endpoints
Both ends use triangle endpoints, useful for indicating direction:
1 2 3 4 5 6 7 8 9 10 11 12 13 14 15 | |
Legend Configuration
Arrow markers can appear in the plot legend. When enabled, the icon draws a horizontal sample line with head and tail endpoints:
1 | |
The default legend icon size is 24×12 pixels. Adjust it with setLegendIconSize():
1 | |
API Reference
| Method | Description |
|---|---|
setPoints(start, end) |
Set start and end points |
setStartPoint(point) |
Set start point |
setEndPoint(point) |
Set end point |
setPositionMode(mode) |
Set positioning mode |
setLength(length) |
Set pixel length (StartLengthAngle mode) |
setAngle(angle) |
Set angle in degrees (StartLengthAngle mode) |
setLinePen(pen) |
Set arrow line pen |
setHeadStyle(style) |
Set head endpoint style |
setHeadSize(size) |
Set head size in pixels |
setHeadBrush(brush) |
Set head fill brush |
setHeadPen(pen) |
Set head outline pen |
setHeadCustomPath(path) |
Set head custom QPainterPath |
setTailStyle(style) |
Set tail endpoint style |
setTailSize(size) |
Set tail size in pixels |
setTailBrush(brush) |
Set tail fill brush |
setTailPen(pen) |
Set tail outline pen |
setTailCustomPath(path) |
Set tail custom QPainterPath |
Tips
- Enable anti-aliasing with
setRenderHint(QwtPlotItem::RenderAntialiased, true)for smoother lines. - In
StartLengthAnglemode, length is in pixels — the arrow does not resize when zooming. - In
ExplicitPointsmode, start/end use plot coordinates — the arrow scales with axis changes.
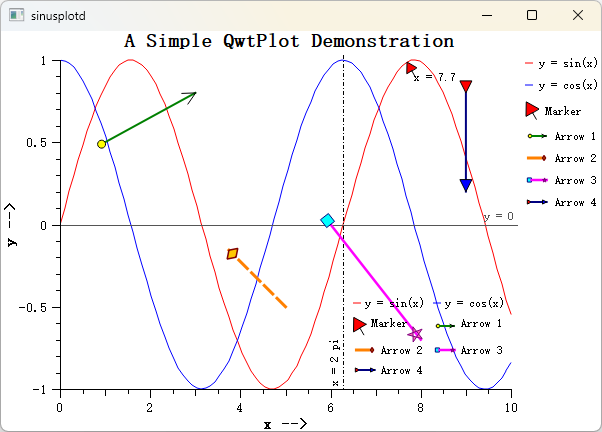
Related Examples
- Arrow annotation demo:
examples/2D/sinusplot
Screenshot of the arrow annotation: