Bar Chart - QwtPlotBarChart
QwtPlotBarChart is a plot item class for drawing bar charts. It supports grouped and stacked bar charts, can be displayed horizontally or vertically, and is suitable for comparative analysis of categorical data.
Key Features
Features
- Grouped/stacked modes: Supports grouped comparison and stacked cumulative display of multiple data sets
- Direction switching: Supports both vertical and horizontal display orientations
- Style customization: Configurable bar fill, border, width, and other properties
- Baseline configuration: Supports custom bar starting baseline position
- Legend modes: Choose to display chart title or individual bar titles
Basic Concepts
Bar Chart Types
Qwt provides two bar chart classes:
| Class |
Description |
QwtPlotBarChart |
Single-group bar chart, one bar per group |
QwtPlotMultiBarChart |
Multi-group bar chart, supports grouped and stacked modes |
Bar Chart Modes
| Mode |
Description |
Grouped |
Grouped mode: Multiple data sets displayed side by side for comparison |
Stacked |
Stacked mode: Multiple data sets stacked to show totals |
Class Inheritance Structure
classDiagram
    class QwtPlotAbstractBarChart {
        +setBaseline()
        +setOrientation()
        +setLayoutPolicy()
        +setLayoutHint()
    }

    class QwtPlotBarChart {
        +setSamples()
        +setSymbol()
        +setPen()
        +setBrush()
        +setLegendMode()
    }

    class QwtPlotMultiBarChart {
        +setSamples()
        +setBarTitles()
        +setSymbol()
        +setSamples()
    }

    QwtPlotAbstractBarChart <|-- QwtPlotBarChart
    QwtPlotAbstractBarChart <|-- QwtPlotMultiBarChart
Usage
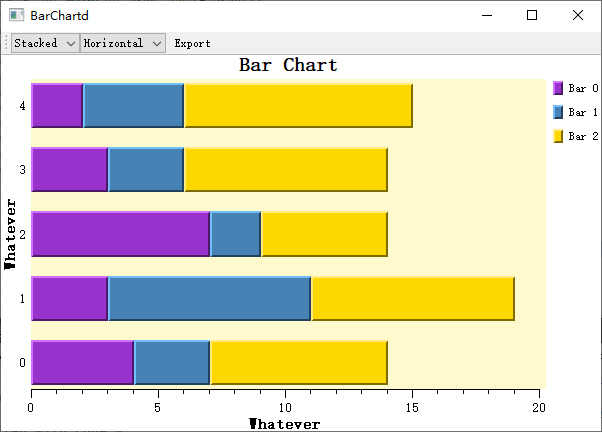
The bar chart example is located at: examples/2D/barchart. Screenshot below:
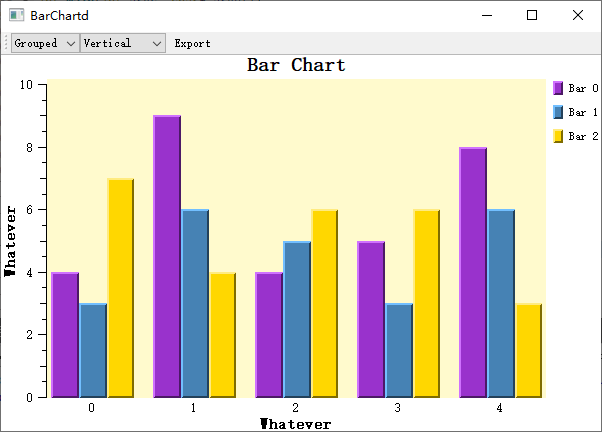
1. Basic Bar Chart
Create the simplest single-group bar chart:
 1
 2
 3
 4
 5
 6
 7
 8
 9
10
11
12
13
14
15
16
17
18
19
20
21
22
23
24 | #include <QwtPlot>
#include <QwtPlotBarChart>
QwtPlot* plot = new QwtPlot();
plot->setTitle("Bar Chart Example");
plot->setCanvasBackground(Qt::white);
// Create bar chart
QwtPlotBarChart* barChart = new QwtPlotBarChart("Sales Data");
// Set data (Y value list, X auto-indexed)
QVector<double> values;
values << 10 << 25 << 15 << 30 << 20;
barChart->setSamples(values);
// Set bar style
barChart->setPen(QPen(Qt::darkBlue, 2)); // Border
barChart->setBrush(QBrush(QColor(100, 150, 200))); // Fill
// Set baseline (bar starting position)
barChart->setBaseline(0.0); // Start from 0
barChart->attach(plot);
plot->replot();
|
2. Setting Data
QwtPlotBarChart provides multiple ways to set data:
 1
 2
 3
 4
 5
 6
 7
 8
 9
10
11
12 | // Method 1: Y values only (X auto-indexed as 0,1,2...)
QVector<double> yValues;
yValues << 10 << 20 << 30 << 40;
barChart->setSamples(yValues);
// Method 2: Specify X and Y coordinates
QVector<QPointF> points;
points << QPointF(1, 10) << QPointF(2, 25) << QPointF(3, 15);
barChart->setSamples(points);
// Method 3: Using QwtSeriesData
barChart->setSamples(seriesData);
|
3. Bar Style Configuration
 1
 2
 3
 4
 5
 6
 7
 8
 9
10
11
12
13
14
15
16
17
18 | #include <QwtColumnSymbol>
// Create column symbol
QwtColumnSymbol* symbol = new QwtColumnSymbol(QwtColumnSymbol::Box);
symbol->setFrameStyle(QwtColumnSymbol::Raised); // Raised border style
// Set border pen
symbol->setPen(QPen(Qt::darkBlue, 1));
// Set fill brush
symbol->setBrush(QBrush(QColor(100, 150, 200, 180)));
// Apply to bar chart
barChart->setSymbol(symbol);
// Or directly set pen and brush (using default style)
barChart->setPen(QPen(Qt::darkGray, 1));
barChart->setBrush(QBrush(Qt::blue));
|
4. Display Orientation
| // Vertical bar chart (default) - X-axis for categories, Y-axis for values
barChart->setOrientation(Qt::Vertical);
// Horizontal bar chart - Y-axis for categories, X-axis for values
barChart->setOrientation(Qt::Horizontal);
|
5. Bar Width Configuration
| // Set layout policy
barChart->setLayoutPolicy(QwtPlotAbstractBarChart::AutoAdjustSamples); // Auto-adjust
// Other options:
// - FixedBarWidth: Fixed width
// - FixedSampleWidth: Fixed sample width (including spacing)
// - AdjustSampleWidth: Adjust based on available space
// Set layout hint value
barChart->setLayoutHint(0.8); // Bar width ratio (relative to sample space)
|
6. Baseline Settings
The baseline defines the starting position of bars:
| // Default baseline is 0
barChart->setBaseline(0.0);
// Set positive baseline (bars start drawing from 10)
barChart->setBaseline(10.0);
// Set negative baseline (can be used to highlight positive values)
barChart->setBaseline(-5.0);
|
7. Multi-Group Bar Chart (QwtPlotMultiBarChart)
1
2
3
4
5
6
7
8
9
10
11
12
13
14
15
16
17
18
19
20
21
22
23
24 | #include <QwtPlotMultiBarChart>
// Create multi-group bar chart
QwtPlotMultiBarChart* multiBar = new QwtPlotMultiBarChart();
multiBar->setTitle("Multi-Group Data Comparison");
// Set titles for each group (used in legend)
QList<QwtText> titles;
titles << QwtText("Group A") << QwtText("Group B") << QwtText("Group C");
multiBar->setBarTitles(titles);
// Set data (each sample contains multiple group values)
QVector<QwtSetSample> samples;
samples << QwtSetSample(0, QVector<double>() << 10 << 20 << 15); // 1st category
samples << QwtSetSample(1, QVector<double>() << 25 << 15 << 30); // 2nd category
samples << QwtSetSample(2, QVector<double>() << 20 << 25 << 10); // 3rd category
multiBar->setSamples(samples);
// Set display mode
multiBar->setChartMode(QwtPlotMultiBarChart::Grouped); // Grouped mode
// Or multiBar->setChartMode(QwtPlotMultiBarChart::Stacked); // Stacked mode
multiBar->attach(plot);
plot->replot();
|
8. Custom Per-Group Bar Styles
| // Create different symbols for each group
QList<QwtColumnSymbol*> symbols;
for (int i = 0; i < 3; i++) {
QwtColumnSymbol* symbol = new QwtColumnSymbol(QwtColumnSymbol::Box);
symbol->setBrush(QBrush(colors[i])); // Different colors
symbol->setPen(QPen(Qt::black, 1));
symbols.append(symbol);
}
multiBar->setSymbols(symbols);
|
Core Methods Summary
QwtPlotBarChart
| Method |
Description |
setSamples() |
Set data |
setSymbol() |
Set bar symbol |
setPen() |
Set border pen |
setBrush() |
Set fill brush |
setBaseline() |
Set baseline position |
setOrientation() |
Set display orientation |
setLayoutPolicy() |
Set layout policy |
setLayoutHint() |
Set layout parameters |
setLegendMode() |
Set legend mode |
QwtPlotMultiBarChart
| Method |
Description |
setBarTitles() |
Set titles for each group |
setSamples() |
Set multi-group data |
setSymbols() |
Set symbols for each group |
setChartMode() |
Set grouped/stacked mode |
Legend Modes
| // Single legend entry (display chart title)
barChart->setLegendMode(QwtPlotBarChart::LegendChartTitle);
// Separate legend entry for each bar
barChart->setLegendMode(QwtPlotBarChart::LegendBarTitles);
|
Related Examples
- Bar chart demo:
examples/2D/barchart