Vector Field Plot - QwtPlotVectorField
QwtPlotVectorField is used to draw vector fields, displaying vector data with direction and magnitude information on a 2D plane. Commonly used in fluid mechanics, electromagnetic field analysis, meteorological data, and other fields.
Key Features
Features
- Arrow symbol display: Uses arrows to represent vector direction and magnitude
- Magnitude mapping: Vector magnitude can be mapped to arrow length or color
- Density control: Supports adjusting display density to avoid overcrowding
- Style customization: Customizable arrow shape and style
Basic Concepts
Vector Field Representation
Vector field data consists of position and vector components:
| ↑ ↗
│ /
│ /
←───●───→───●───→
│ \
│ \
↓ ↙
Each point displays a vector (direction + magnitude)
|
Data Structure
Uses QwtVectorFieldSample to represent a single vector:
| struct QwtVectorFieldSample {
double x; // X coordinate
double y; // Y coordinate
double vx; // X component
double vy; // Y component
};
|
Usage
The vector field example is located at: playground/vectorfield. Screenshot below:
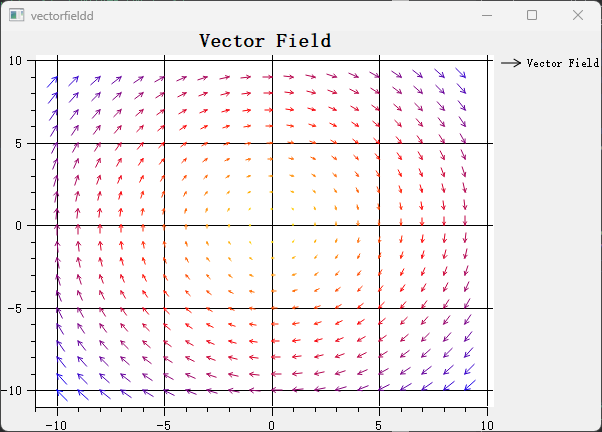
1. Basic Vector Field Plot
1
2
3
4
5
6
7
8
9
10
11
12
13
14
15
16
17
18
19
20
21
22
23 | #include <QwtPlot>
#include <QwtPlotVectorField>
QwtPlot* plot = new QwtPlot();
plot->setTitle("Vector Field Example");
plot->setCanvasBackground(Qt::white);
// Create vector field
QwtPlotVectorField* vectorField = new QwtPlotVectorField();
// Prepare data
QVector<QwtVectorFieldSample> samples;
for (int x = 0; x < 10; x++) {
for (int y = 0; y < 10; y++) {
double vx = std::sin(y * 0.5); // X component
double vy = std::cos(x * 0.5); // Y component
samples << QwtVectorFieldSample(x, y, vx, vy);
}
}
vectorField->setSamples(samples);
vectorField->attach(plot);
plot->replot();
|
2. Arrow Style Configuration
1
2
3
4
5
6
7
8
9
10
11
12
13 | #include <QwtVectorFieldSymbol>
// Create arrow symbol
QwtVectorFieldSymbol* symbol = new QwtVectorFieldSymbol();
symbol->setStyle(QwtVectorFieldSymbol::Arrow); // Arrow style
// Set arrow color
symbol->setPen(QPen(Qt::blue, 1));
// Set arrow length scale
vectorField->setMagnitudeScaleFactor(0.5); // Scale factor
vectorField->setSymbol(symbol);
|
3. Vector Magnitude Mapping
| // Map vector magnitude to arrow length
vectorField->setMagnitudeScaleFactor(1.0); // Linear mapping
// Set fixed arrow length (ignore magnitude)
vectorField->setMagnitudeScaleFactor(0.0);
vectorField->setSymbolSize(10); // Fixed 10 pixels
|
4. Display Density Control
| // Set sampling density (avoid overcrowding)
vectorField->setSamplesPerInch(20); // 20 vectors per inch
// Or set fixed skip interval
vectorField->setIndirectionCount(2); // Display every 2nd point
|
5. Color Mapping
| #include <QwtColorMap>
// Set color based on vector magnitude
QwtLinearColorMap* colorMap = new QwtLinearColorMap(Qt::blue, Qt::red);
vectorField->setColorMap(colorMap);
vectorField->setColorMagnitude(true); // Enable color mapping
|
Core Methods Summary
| Method |
Description |
setSamples() |
Set vector data |
setSymbol() |
Set arrow symbol |
setMagnitudeScaleFactor() |
Set magnitude scale factor |
setSamplesPerInch() |
Set display density |
setColorMap() |
Set color map |
setColorMagnitude() |
Enable color-magnitude mapping |
Application Scenarios
- Fluid mechanics: Flow velocity field visualization
- Electromagnetics: Electric/magnetic field distribution
- Meteorology: Wind direction field display
- Mathematical analysis: Vector function visualization
Related Examples
- Vector field demo:
playground/vectorfield