Marker - QwtPlotMarker
QwtPlotMarker is a plot item for marking specific positions on a plot. It can display horizontal lines, vertical lines, crosshair lines, symbols, or text labels, and is commonly used to annotate key data points, threshold lines, or reference positions.
Key Features
Features
- Multiple line styles: Horizontal line, vertical line, crosshair, or no line
- Symbol markers: Display custom symbols at specified positions
- Text labels: Add text annotations with controllable position and orientation
- Precise positioning: Located using coordinate values, automatically follows axis transformations
Basic Concepts
Line Style Types
QwtPlotMarker supports four line styles:
| Style |
Enum Value |
Description |
| No line |
NoLine |
Show symbols and labels only |
| Horizontal line |
HLine |
Horizontal line through the marker point |
| Vertical line |
VLine |
Vertical line through the marker point |
| Crosshair |
Cross |
Combination of horizontal and vertical lines |
Marker Composition
| Label text
↓
────────●──────── ← Horizontal line + symbol
│
│ ← Vertical line
│
(x, y) Coordinate point
|
Usage
1. Creating a Basic Marker
1
2
3
4
5
6
7
8
9
10
11
12
13
14
15
16
17
18 | #include <QwtPlot>
#include <QwtPlotMarker>
QwtPlot* plot = new QwtPlot();
// Create marker
QwtPlotMarker* marker = new QwtPlotMarker();
// Set marker position (coordinate values)
marker->setXValue(5.0);
marker->setYValue(10.0);
// Or use setValue(double x, double y)
marker->setValue(5.0, 10.0);
// Attach to plot
marker->attach(plot);
plot->replot();
|
2. Horizontal Line Marker
Horizontal lines are commonly used to mark thresholds, baseline values, or Y-axis reference lines:
1
2
3
4
5
6
7
8
9
10
11
12
13
14
15
16 | QwtPlotMarker* hLine = new QwtPlotMarker();
// Set line style to horizontal
hLine->setLineStyle(QwtPlotMarker::HLine);
// Set Y coordinate (position of the horizontal line)
hLine->setYValue(50.0); // Horizontal line at Y=50
// Set line style
hLine->setLinePen(QPen(Qt::red, 2.0, Qt::DashLine));
// Optional: Add label
hLine->setLabel(QwtText("Threshold Line"));
hLine->setLabelAlignment(Qt::AlignRight | Qt::AlignTop);
hLine->attach(plot);
|
3. Vertical Line Marker
Vertical lines are used to mark time points, event positions, or X-axis reference lines:
1
2
3
4
5
6
7
8
9
10
11
12 | QwtPlotMarker* vLine = new QwtPlotMarker();
// Set line style to vertical
vLine->setLineStyle(QwtPlotMarker::VLine);
// Set X coordinate
vLine->setXValue(100.0); // Vertical line at X=100
// Set line style
vLine->setLinePen(QPen(Qt::blue, 1.5, Qt::DotLine));
vLine->attach(plot);
|
4. Crosshair Marker
Crosshair lines display horizontal and vertical intersecting lines at a specific coordinate point:
1
2
3
4
5
6
7
8
9
10
11
12 | QwtPlotMarker* cross = new QwtPlotMarker();
// Set crosshair style
cross->setLineStyle(QwtPlotMarker::Cross);
// Set center position
cross->setValue(50.0, 50.0);
// Set line style
cross->setLinePen(QPen(Qt::green, 1.0, Qt::SolidLine));
cross->attach(plot);
|
5. Symbol Marker
Display a symbol at a specific position (without lines):
 1
 2
 3
 4
 5
 6
 7
 8
 9
10
11
12
13
14
15
16
17
18
19
20 | #include <QwtSymbol>
QwtPlotMarker* symbolMarker = new QwtPlotMarker();
// No lines displayed
symbolMarker->setLineStyle(QwtPlotMarker::NoLine);
// Set position
symbolMarker->setValue(3.0, 8.0);
// Create symbol
QwtSymbol* symbol = new QwtSymbol(
QwtSymbol::Diamond,
QBrush(Qt::red),
QPen(Qt::darkRed, 2),
QSize(12, 12)
);
symbolMarker->setSymbol(symbol);
symbolMarker->attach(plot);
|
6. Text Label Configuration
Add text annotations to markers:
 1
 2
 3
 4
 5
 6
 7
 8
 9
10
11
12
13
14
15
16
17
18
19
20
21
22
23
24
25
26 | #include <QwtText>
QwtPlotMarker* labelMarker = new QwtPlotMarker();
labelMarker->setValue(10.0, 20.0);
labelMarker->setLineStyle(QwtPlotMarker::Cross);
// Create text label
QwtText label("Key Point (10, 20)");
label.setColor(Qt::black);
label.setFont(QFont("Arial", 10, QFont::Bold));
// Set label
labelMarker->setLabel(label);
// Set label alignment
// Position relative to the marker point
labelMarker->setLabelAlignment(Qt::AlignLeft | Qt::AlignBottom);
// Set label orientation
labelMarker->setLabelOrientation(Qt::Horizontal); // Horizontal text
// Or labelMarker->setLabelOrientation(Qt::Vertical); // Vertical text
// Set spacing between label and marker point
labelMarker->setSpacing(5); // 5 pixel spacing
labelMarker->attach(plot);
|
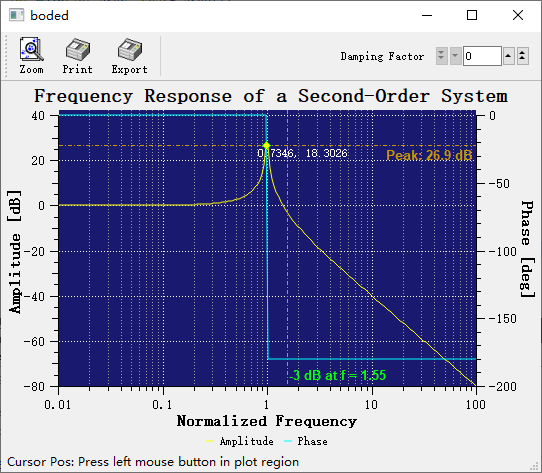
7. Comprehensive Example - Annotating Data Peaks
 1
 2
 3
 4
 5
 6
 7
 8
 9
10
11
12
13
14
15
16
17
18
19
20
21
22
23
24
25
26
27
28
29
30
31
32
33
34
35
36
37
38
39 | // Find data peak and annotate it
QwtPlotCurve* curve = new QwtPlotCurve("Data");
curve->setSamples(xData, yData, count);
curve->attach(plot);
// Find the maximum value point
double maxVal = yData[0];
int maxIdx = 0;
for (int i = 1; i < count; i++) {
if (yData[i] > maxVal) {
maxVal = yData[i];
maxIdx = i;
}
}
// Create peak marker
QwtPlotMarker* peakMarker = new QwtPlotMarker();
peakMarker->setValue(xData[maxIdx], yData[maxIdx]);
// Set style
peakMarker->setLineStyle(QwtPlotMarker::VLine); // Vertical reference line
peakMarker->setLinePen(QPen(Qt::red, 1, Qt::DashLine));
// Set symbol
QwtSymbol* peakSymbol = new QwtSymbol(
QwtSymbol::Triangle,
QBrush(Qt::red),
QPen(Qt::darkRed, 1),
QSize(10, 10)
);
peakMarker->setSymbol(peakSymbol);
// Set label
QwtText label(QString("Peak: %1").arg(maxVal));
label.setColor(Qt::red);
peakMarker->setLabel(label);
peakMarker->setLabelAlignment(Qt::AlignTop | Qt::AlignHCenter);
peakMarker->attach(plot);
|
Label Alignment Positions
Label alignment relative to the marker point is controlled by Qt::AlignmentFlag:
| Alignment |
Position Description |
Qt::AlignLeft | Qt::AlignTop |
Upper left |
Qt::AlignRight | Qt::AlignTop |
Upper right |
Qt::AlignLeft | Qt::AlignBottom |
Lower left |
Qt::AlignRight | Qt::AlignBottom |
Lower right |
Qt::AlignHCenter | Qt::AlignTop |
Directly above |
Qt::AlignHCenter | Qt::AlignBottom |
Directly below |
Qt::AlignLeft | Qt::AlignVCenter |
Directly left |
Qt::AlignRight | Qt::AlignVCenter |
Directly right |
Core Methods Summary
| Method |
Description |
setValue(x, y) |
Set marker position coordinates |
setXValue(x) |
Set X coordinate only |
setYValue(y) |
Set Y coordinate only |
value() |
Get marker position coordinates |
xValue() |
Get X coordinate |
yValue() |
Get Y coordinate |
setLineStyle() |
Set line style |
lineStyle() |
Get line style |
setLinePen() |
Set line pen |
linePen() |
Get line pen |
setSymbol() |
Set symbol |
symbol() |
Get symbol |
setLabel() |
Set text label |
label() |
Get text label |
setLabelAlignment() |
Set label alignment |
setLabelOrientation() |
Set label orientation |
setSpacing() |
Set label spacing |
Marker Layer Control
Markers should typically be drawn above other plot items. This can be controlled by setting the Z value:
| marker->setZ(100); // Higher Z value draws on top
|
Related Examples
- Curve peak annotation:
examples/2D/bode
- Curve tracker:
playground/curvetracker
Screenshot of the curve peak annotation: