Shape Item - QwtPlotShapeItem
QwtPlotShapeItem is used to display arbitrary shapes on a plot, supporting rectangles, circles, polygons, paths, and other geometric figures. Shapes are positioned using plot coordinates and automatically adjust with axis transformations.
Key Features
Features
- Arbitrary shape support: Supports various geometric shapes defined by QPainterPath
- Coordinate binding: Shape positions use plot coordinates, scaling with transformations
- Style customization: Configurable fill, border, color, and other styles
- Fill optimization: Supports multiple fill modes for improved rendering performance
Basic Concepts
Shape Positioning
QwtPlotShapeItem shapes are positioned using plot coordinates, not pixel coordinates:
1 2 3 4 5 6 | |
Fill Modes
| Mode | Enum Value | Description |
|---|---|---|
| Base fill | Base |
Simple fill, best performance |
| Graphic fill | Graphic |
Stored using QwtGraphic, supports caching |
Usage
1. Creating a Rectangle Shape
1 2 3 4 5 6 7 8 9 10 11 12 13 14 15 16 17 18 19 20 | |
2. Creating a Circle Shape
1 2 3 4 5 6 7 8 9 10 | |
3. Creating a Polygon Shape
1 2 3 4 5 6 7 8 9 10 11 12 13 | |
4. Style Configuration
1 2 3 4 5 6 7 8 9 10 11 | |
Core Methods Summary
| Method | Description |
|---|---|
setShape() |
Set shape path |
setPen() |
Set border pen |
setBrush() |
Set fill brush |
setFillMode() |
Set fill mode |
setRenderHint() |
Set render hint |
Application Scenarios
- Region annotation
- Background areas
- Clip region marking
- Custom geometric shapes
Related Examples
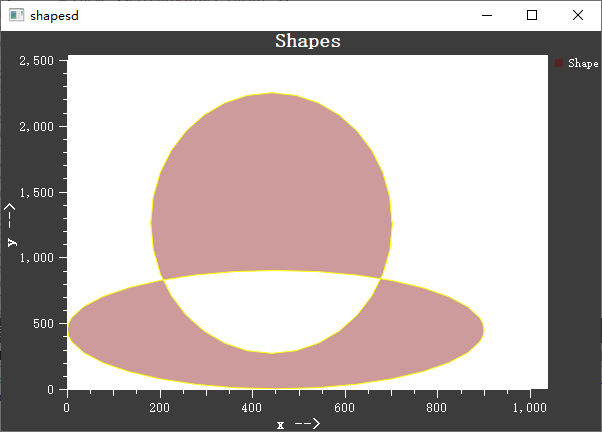
- Shape demo:
playground/shapes
Screenshot of the shape demo: