Qwt 7.0 New Features — A More Modern and Powerful Qt Data Visualization Library
Qwt 7.0 is a modernized version based on the original Qwt 6.2.0, following the Qwt open-source license (LGPL), maintained and continuously updated by the community. This version not only brings C++11/17 standard support and a CMake build system, but also introduces a large number of practical new features, making data visualization development more convenient and efficient.
This article provides a comprehensive overview of the core new features in Qwt 7.0+, helping you quickly understand and get started with this more powerful data visualization library.
Integrated 2D/3D Plotting
Qwt Supports Both 2D and 3D
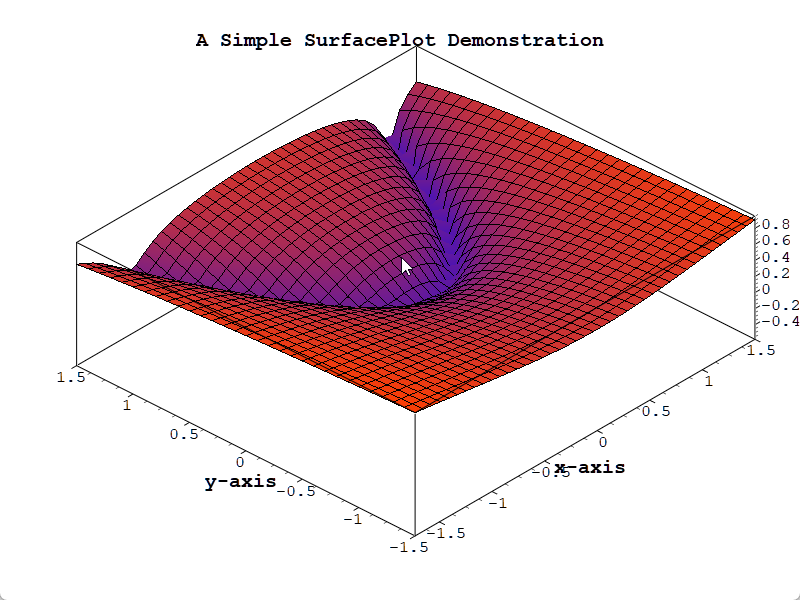
Qwt 7.0 integrates the original QwtPlot3D library, achieving unified 2D and 3D plotting support. Now a single library can satisfy both two-dimensional and three-dimensional data visualization needs.
3D Plotting Module Overview
Qwt 7.0 includes built-in complete 3D plotting capabilities, supporting:
- ✅ Multiple Plot Types: Surface plots, mesh plots, parametric surfaces, function plots, etc.
- ✅ OpenGL Rendering: High-performance 3D rendering with smooth interactive experience
- ✅ Interactive Operations: Mouse rotation, zooming, and panning
- ✅ Lighting and Materials: Realistic lighting effects and material configuration
- ✅ Color Mapping: Automatic color mapping based on Z values, with color bar support
3D Plotting Effects
Core Classes
| Class | Description |
|---|---|
Qwt3D::Plot3D |
3D plot base class, providing the basic framework and interaction |
Qwt3D::SurfacePlot |
3D surface plot, displaying continuous surfaces (handles both grid and cell data) |
Qwt3D::Function |
3D function plot, generating surfaces from mathematical functions |
Namespace
All 3D classes live in the Qwt3D namespace. The Qwt3DPlot3D/Qwt3DSurfacePlot/Qwt3DFunction names sometimes seen online are incorrect — the real names omit the redundant Qwt3D prefix on the class itself.
Usage Example
1 2 3 4 5 6 7 8 9 10 11 12 13 14 15 16 17 18 19 20 21 22 23 24 25 | |
CMake Configuration
1 2 3 4 5 6 7 | |
Advantages of Integrated 2D/3D
- Unified Import: No need to import two separate libraries, simplifying project dependencies
- Consistent Style: Unified 2D and 3D plotting API style, reducing the learning curve
- Flexible Selection: Link 2D or 3D modules independently based on requirements
Complete Example
For detailed usage, refer to Introduction to 3D Plotting. Example code is located in examples/3D/simpleplot3D.
Architecture and Build Upgrades
C++11/17 Standard Support
Qwt 7.0 fully embraces modern C++ standards:
- Qt5.12+: Uses C++11 standard
- Qt6: Uses C++17 standard
This means you can use modern C++ features such as auto, nullptr, override, final, lambda expressions, smart pointers, etc., resulting in cleaner and safer code.
CMake Build System
Leaving behind the traditional qmake, Qwt 7.0 adopts a modern CMake build system:
1 2 3 4 5 | |
Single-File Import Method
Qwt 7.0 provides an extremely simple import method — merging the entire library into single files:
src-amalgamate/QwtPlot.h— Merged single header filesrc-amalgamate/QwtPlot.cpp— Merged single source file
Simply add these two files to your project without complex build configuration, which is especially suitable for small projects or rapid prototyping.
Note
The single files are automatically generated by a tool. Do not directly edit the QwtPlot.h and QwtPlot.cpp files.
QwtFigure — Multi-Plot Layout Container
Core New Feature
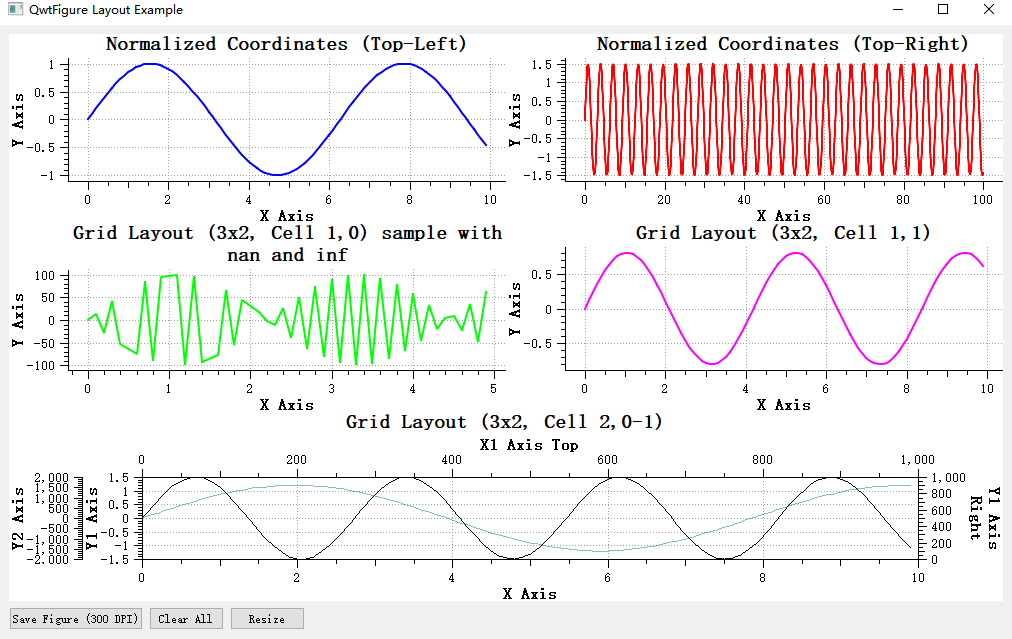
QwtFigure is one of the most important new additions in Qwt 7.0, providing multi-plot layout capabilities similar to matplotlib's Figure.
Feature Overview
QwtFigure is a container window for organizing and managing multiple QwtPlot plotting components, providing:
- Normalized Coordinate Layout: Use a
[0,1]coordinate system for relative position control - Grid Layout: Row-column grid arrangement, following matplotlib's subplot approach
- Parasite Axes Support: Create multiple independent axes within the same plot area
- Graphics Export: Support for high-resolution image output
Usage Example
1 2 3 4 5 6 7 8 9 10 11 | |
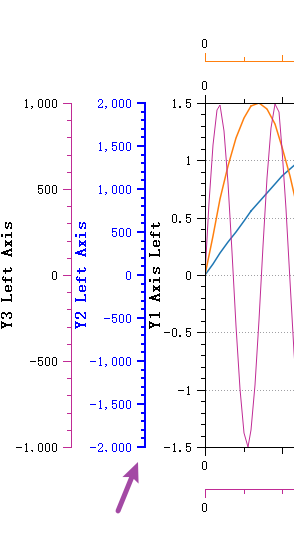
Axis Alignment Feature
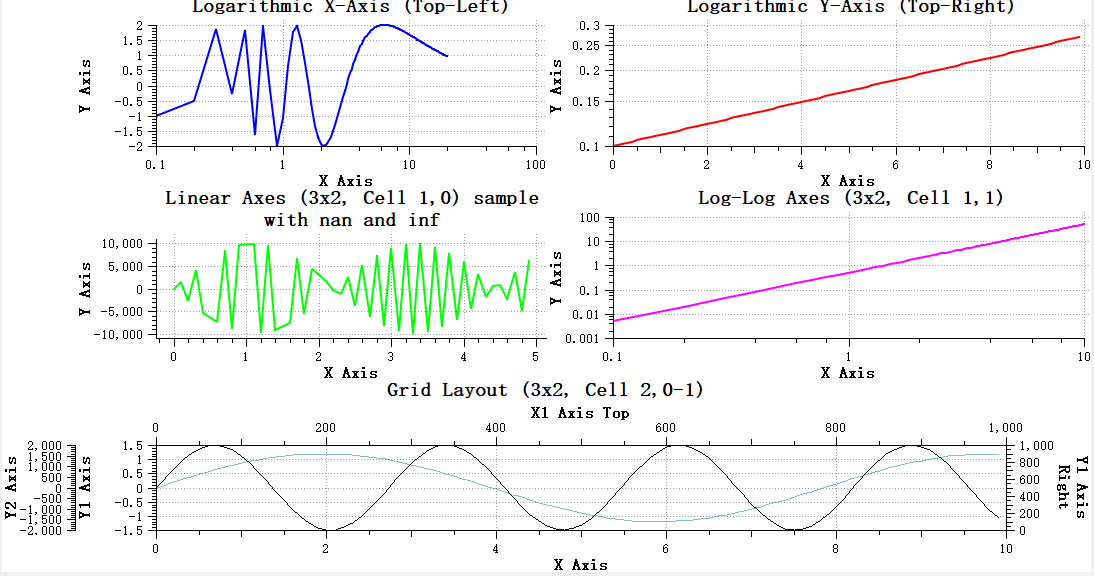
When multiple sub-plots have different scale ranges, tick marks may not align, affecting visual appearance. QwtFigure provides axis alignment functionality:
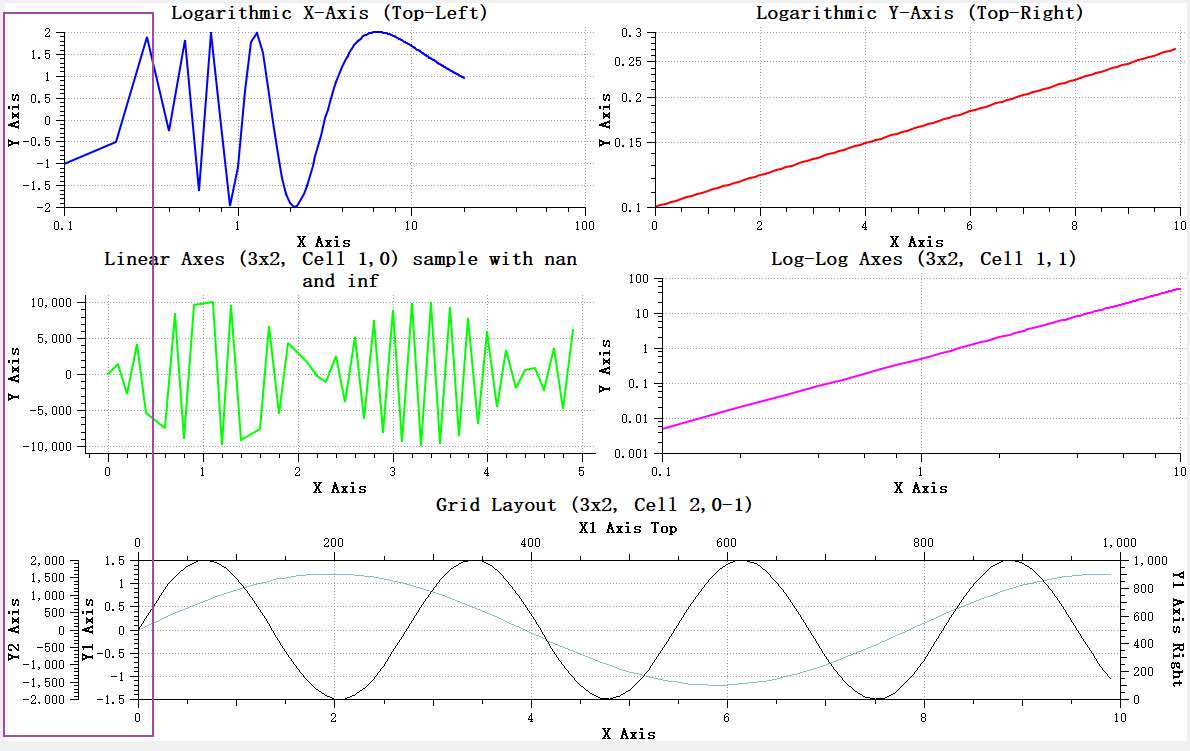
The addAxisAlignment function can be used to specify which sub-plot axes should be aligned:
1 | |
Result after alignment:
Interactive Operation Overlay
QwtFigureWidgetOverlay provides interactive operation capabilities on QwtFigure:
- Supports mouse dragging to adjust the position and size of sub-plots
- Supports selecting the currently active plot component
- Provides clear visual feedback (borders, control points, size information)
Complete Example
For detailed usage, refer to QwtFigure Plot Container Window. Example code is located in examples/figure.
Parasite Axes — Multi-Axis System
Core New Feature
Parasite Axes allow creating any number of independent axes within the same plot area, perfectly solving complex multi-Y-axis and multi-X-axis plotting requirements.
How It Works
Parasite plots share the plot area with the host plot (transparent background) but have independent coordinate systems. When the host plot is destroyed, parasite plots are automatically destroyed as well, with lifecycle automatically managed.
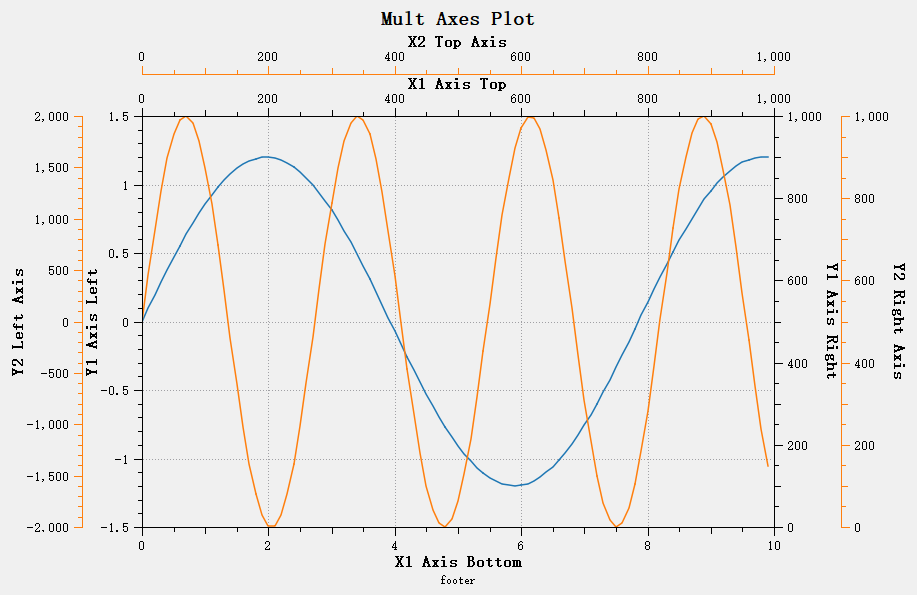
Creating a Parasite Plot
1 2 3 4 5 6 7 8 9 10 11 12 13 14 | |
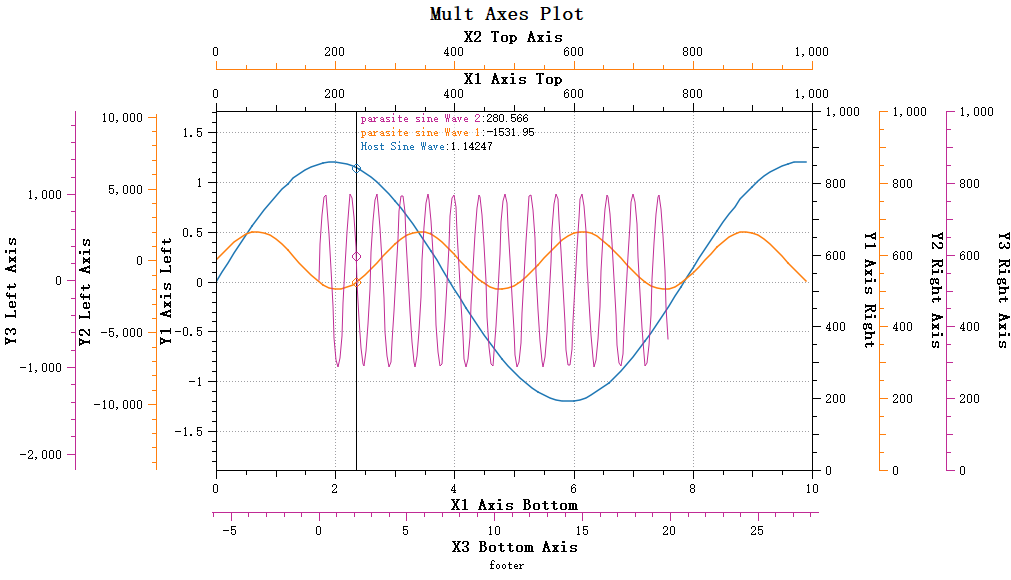
Multiple Parasite Plot Overlay
Multiple parasite plots can be created to overlay any number of axes:
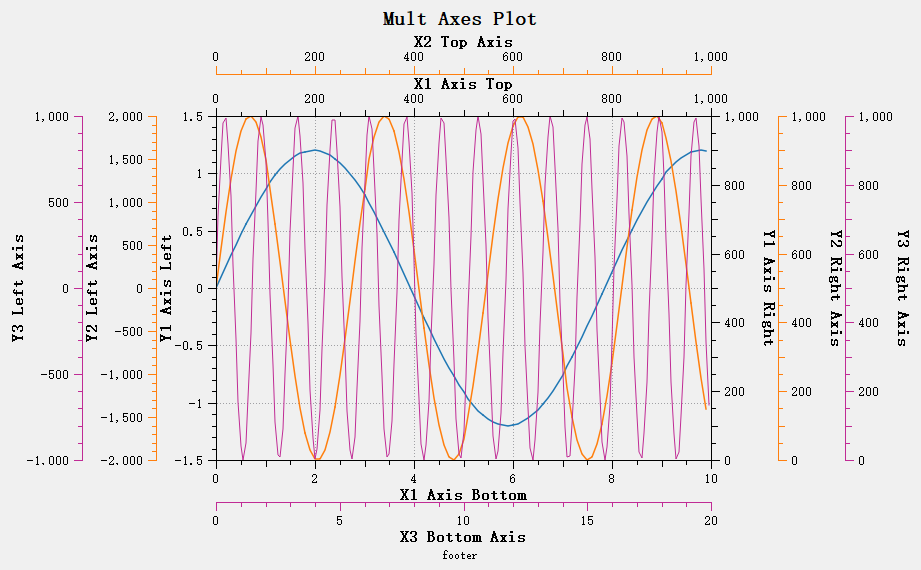
Complete Example
For detailed usage, refer to the Parasite Axes Guide. Example code is located in examples/parasitePlot.
Interaction Feature Overhaul
Major Improvement
Qwt 7.0 has completely overhauled interactive controls, providing a smoother user experience.
Real-Time Panning — QwtPlotPanner
The original Qwt QwtPanner used bitmap caching for panning, which meant data changes were not visible during the pan operation. Qwt 7.0 has rebuilt QwtPlotPanner based on the QwtPicker state machine to implement real-time panning:
Features:
- ✅ Full support for linear axes, logarithmic axes, and date-time axes
- ✅ Real-time synchronized movement of multiple axes
- ✅ Plot refreshes in real time during panning
Canvas-Wide Zooming — QwtPlotCanvasZoomer
The original QwtPlotZoomer could only bind to two axes and could not handle four-axis simultaneous zooming scenarios. Qwt 7.0 introduces QwtPlotCanvasZoomer, which requires no axis specification and automatically handles zooming for the entire canvas:
1 2 | |
Class Name Changes
To maintain naming clarity, some class names have been adjusted:
| Original Name | New Name | Description |
|---|---|---|
QwtPlotZoomer |
QwtPlotAxisZoomer |
Can only bind 2 axes, renamed to axis zoomer |
| - | QwtPlotCanvasZoomer |
New: canvas-wide zoomer |
QwtPanner |
QwtCachePanner |
Cache-based panner |
QwtPlotPanner |
QwtPlotCachePanner |
Cache-based plot panner |
| - | QwtPlotPanner |
New: real-time panner |
Migration Tip
Existing code requires minimal changes, as the new interfaces maintain backward compatibility. To use the original cache-based panning, use the CachePanner related classes.
Complete Example
For detailed usage, refer to the Panner Tool and Zoomer Tool.
Built-in Axis Interactive Actions
New Feature v7.0.5+
Axis interactive actions allow users to directly manipulate axes with the mouse, providing an experience similar to QCustomPlot.
Feature Demonstration
Axis Drag Operation:
- Left-click to select an axis
- Drag to move the axis range
- Right-click to deselect
Axis Scroll Wheel Zoom:
- Left-click to select an axis
- Scroll wheel to zoom, with zoom center at the mouse position
- Right-click to deselect
Usage
Qwt 7 enables axis interaction by default:
1 2 3 4 5 | |
Selection Effect Customization
When an axis is selected, visual effects can be customized:
1 2 3 4 5 | |
Complete Example
For detailed usage, refer to Axis Interactive Actions.
Data Picking Feature
New Feature v7.0.6+
QwtPlotSeriesDataPicker provides powerful data picking capabilities, displaying data point information in real time as the mouse moves.
Feature Demonstration
Two Picking Modes
Y-Value Picking Mode:
Displays the Y values for all curves at the current X position, with support for linear interpolation.
Nearest Point Picking Mode:
Calculates and picks the closest point to the mouse cursor, suitable for peak data picking scenarios.
Usage Example
1 2 3 4 5 6 7 8 9 10 11 | |
Performance Optimization
For large datasets, Qwt 7 provides a window search algorithm:
- Default activation threshold: 1,000 data points
- Search window defaults to 5% of the curve point count
- Avoids full curve traversal, significantly improving performance
Complete Example
For detailed usage, refer to Data Picking.
New Chart Types
Box Chart — QwtPlotBoxChart
New Feature v7.2.0+
QwtPlotBoxChart provides complete box-and-whisker plot support, visually presenting statistical distribution characteristics of data.
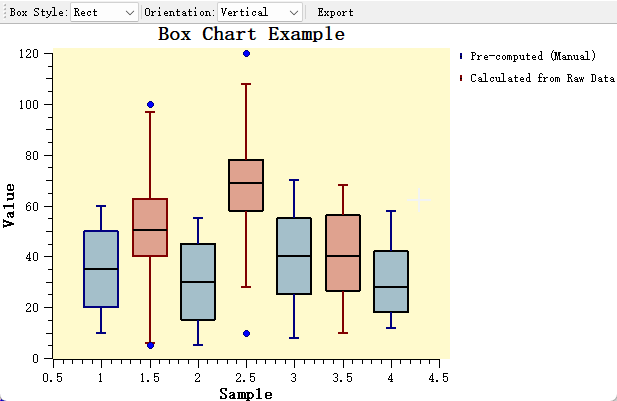
Features
- ✅ Supports both pre-computed data and automatic calculation from raw data
- ✅ Multiple whisker calculation methods: Tukey (1.5×IQR), percentile, min/max, standard deviation, standard error
- ✅ Three box styles: rectangle, diamond, notch
- ✅ Vertical and horizontal orientation switching
- ✅ Automatic outlier detection, custom symbols, and jitter display
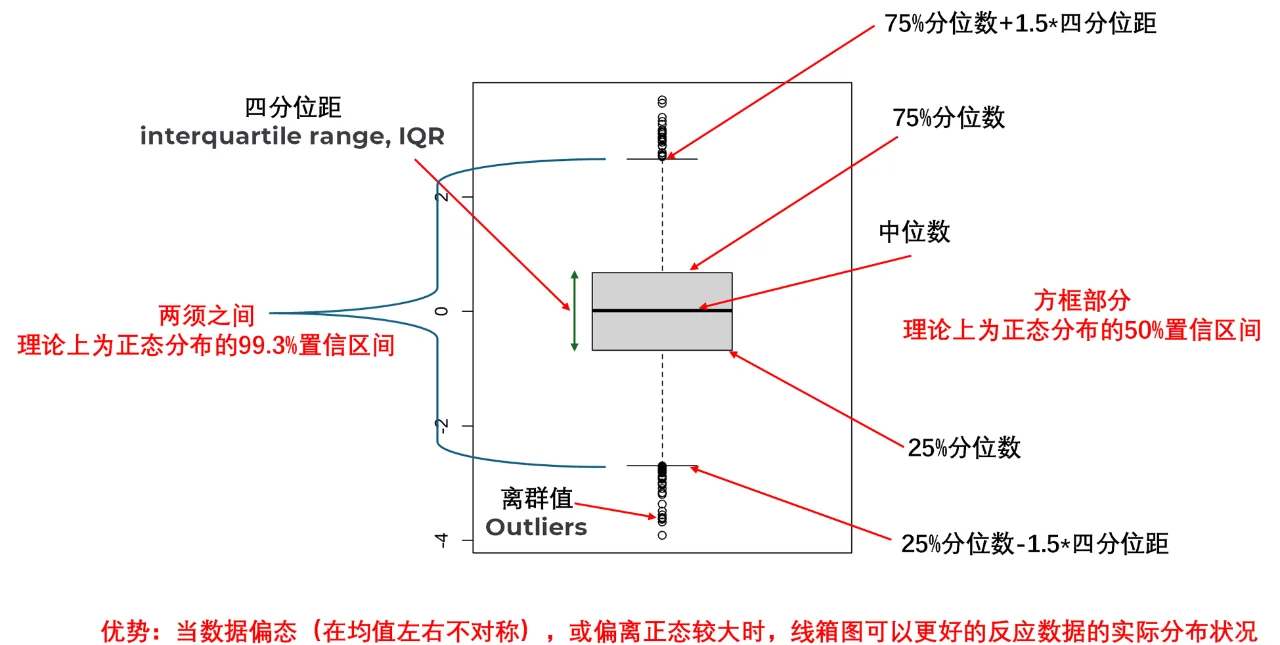
Box Chart Structure
Usage Example
1 2 3 4 5 6 7 8 9 10 11 12 | |
Complete Example
For detailed usage, refer to the Box Chart Guide. Example code is located in examples/2D/boxchart.
Other Useful Features
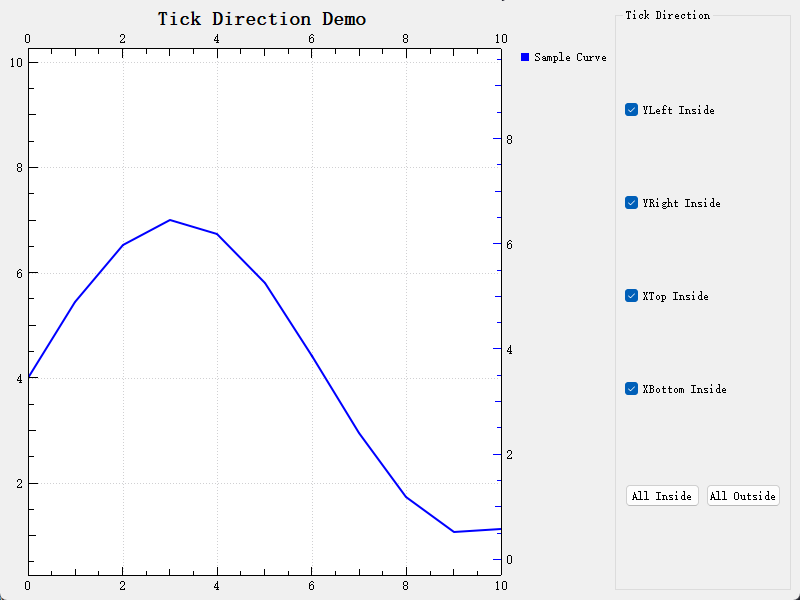
Inward-Facing Ticks
New Feature v7.2.1+
Supports displaying axis tick marks inside the plot area, suitable for compact layout scenarios.
1 2 3 | |
Complete Example
For detailed usage, refer to the Inward-Facing Ticks Guide. Example code is located in examples/2D/ticks_inside.
NaN/Inf Anomaly Value Handling
Qwt 7.0 includes improved handling of anomalous values (NaN, Inf) in data:
QwtPointMapperadds anomaly handling so that data anomalies do not cause coordinate mapping errors- Data range calculation includes anomaly value filtering
- Plotting is more stable and will not crash due to anomalous data
QwtGridRasterData Grid Interpolation
The new QwtGridRasterData class, compared to QwtMatrixRasterData:
- Supports 2D data table input
- Supports X/Y axis grid interpolation
- More flexible spectrogram data processing
Bar Chart Interface Enhancements
QwtPlotBarChart interface enhancements include:
- Pen style settings
- Brush (fill) style settings
- Richer bar chart appearance customization
Migration Guide
Class Name Change Reference
| Original Name | New Name | Migration Advice |
|---|---|---|
QwtPlotZoomer |
QwtPlotAxisZoomer |
Simply replace the class name in code |
QwtPanner |
QwtCachePanner |
Replace if cache-based panning is needed |
QwtPlotPanner |
QwtPlotCachePanner |
Replace if cache-based panning is needed |
| - | QwtPlotPanner |
New feature: real-time panning |
| - | QwtPlotCanvasZoomer |
New feature: canvas-wide zooming |
API Changes
QwtLinearColorMap::colorStop()→stopPos()QwtLinearColorMapaddsstopColors()method
Compatibility
- Qt5.12+ fully compatible
- Qt6 fully supported
- Most Qwt 6.x code can be used directly, requiring only minor class name replacements
Summary
Qwt 7.0 is a comprehensive modernization upgrade:
| Category | New Features |
|---|---|
| Architecture Upgrade | C++11/17, CMake build, single-file import |
| Integrated 2D/3D | QwtPlot3D integration, unified library supporting 2D and 3D plotting |
| Layout Features | QwtFigure multi-plot container, parasite axes for multi-axis support |
| Interaction Improvements | Real-time panning, canvas-wide zooming, built-in axis interaction |
| Data Picking | Y-value picking, nearest-point picking, smart interpolation |
| Chart Types | Box chart, inward-facing ticks, 3D surface/mesh plots |
| Stability | NaN/Inf handling, anomaly value filtering |
These new features make Qwt a more modern, more powerful, and more user-friendly Qt data visualization library — a single library supporting both 2D and 3D plotting — suitable for scientific computing, engineering applications, data analysis, and many other scenarios.
Get More Information
- Project Repository: GitHub / Gitee
- Build Instructions: Build Guide
- Import Method: Importing Qwt
- Changelog: CHANGES.md