QwtFigure Plot Container Window
QwtFigure is a container similar to matplotlib's Figure class, used to organize and manage multiple QwtPlot plotting components. It provides flexible layout options including normalized coordinate positioning and grid layout, and supports creating parasite plots (with any number of X and Y axes).
Key Features
1. Multiple Layout Methods
- Normalized coordinate layout: Uses a coordinate system in the
[0,1]range for relative position control - Grid layout: Supports row-column grid arrangement for creating well-organized multi-plot compositions
2. Parasite Plot Support
- Can create parasite plots for a host plot that share the plot area but have independent axes
- Suitable for displaying data of different magnitudes within the same plot area
3. Graphics Export
- Supports exporting the entire figure to an image file or QPixmap
- DPI can be specified for high-resolution output
4. Flexible Appearance Customization
- Supports custom background color, border color, and line width
- Supports complex backgrounds (gradients, textures, etc.)
Usage
QwtFigure is a window container that can layout multiple sub-plots (QwtPlot).
Adding Plot Components
Adding with Normalized Coordinates
Normalized coordinates represent the percentage of the QwtFigure window.
1 2 3 4 5 6 | |
Normalized Coordinate Notes
- Uses the standard Qt top-left coordinate system
- Normalized coordinate range is [0,1]
Adding with Grid Layout
The grid layout follows the subplot layout approach from matplotlib.
1 2 3 4 5 6 7 8 | |
Setting Figure Appearance
1 2 3 4 5 6 7 8 9 10 11 12 | |
Using Parasite Plots
Parasite plots (named after matplotlib's parasite axes) allow creating multiple plots with independent axes, suitable for displaying data of different magnitudes or units within the same plot area. Common use cases include dual Y-axis and multi-Y-axis plots.
Example code for creating parasite plots:
1 2 3 4 5 6 7 8 9 10 | |
Parasite Plot Notes
- Parasite plots cannot be the currently active axis
- Parasite plots are automatically hidden when the host axis is removed
- If the host plot is destroyed, the parasite plot is destroyed along with it
For detailed usage of parasite plots, refer to: Parasite Plots
Below is a more complete demonstration using QwtFigure:
1 2 3 4 5 6 7 8 9 10 11 12 13 14 15 16 17 18 19 20 21 22 23 24 25 26 27 28 29 30 31 32 33 34 | |
The result of the above example is shown below:
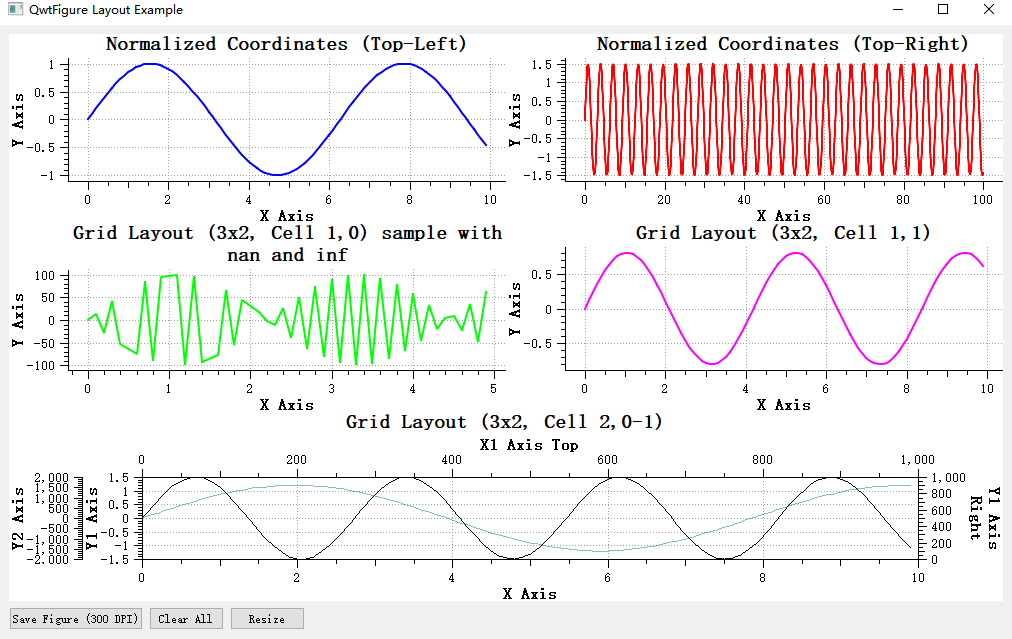
Figure Export
1 2 3 4 5 | |
Axis Alignment
The figure window provides axis alignment functionality. If the tick values of sub-plots differ significantly, the ticks will not be aligned, as shown below:
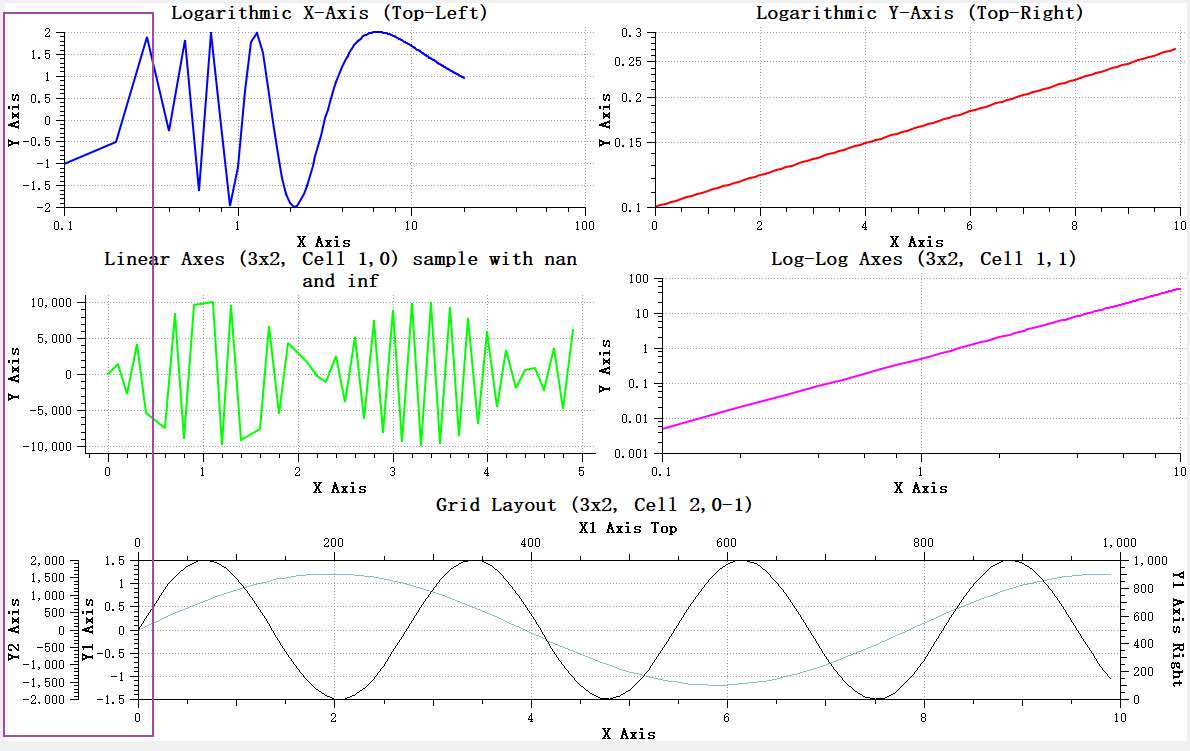
In this case, you can specify axis alignment using the QwtFigure::addAxisAlignment function.
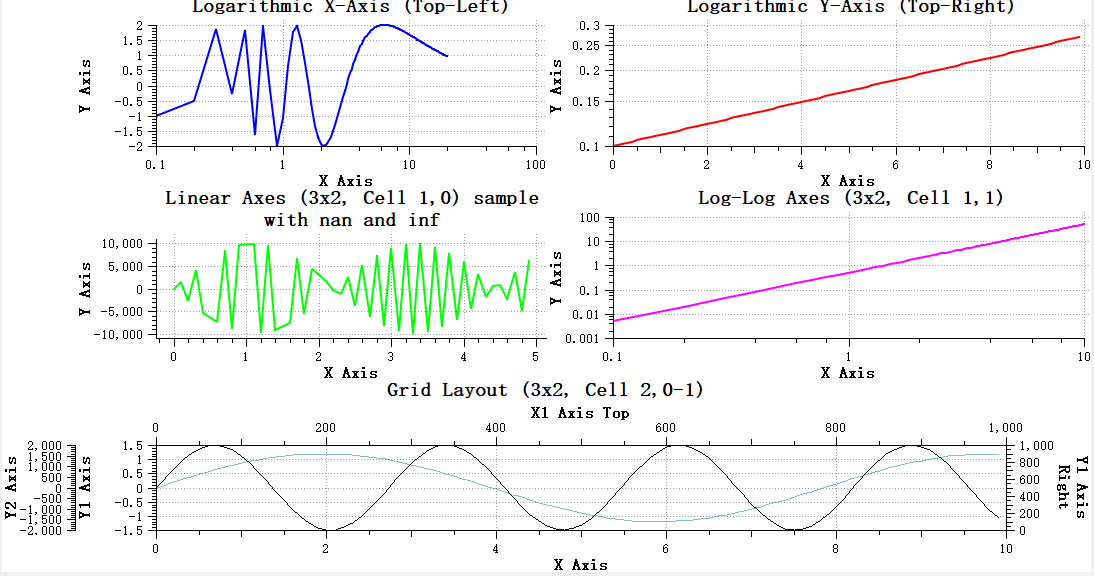
For the example above, axis alignment can be achieved with:
1 2 | |
The code above means the left Y-axes of plot1, plot3, and hostPlot are aligned with each other. The left Y-axes of plot2 and plot4 are aligned with each other.
The result is shown below:
Axis Alignment Notes
Only visible axes can be aligned. If an axis is not visible, it cannot be aligned. For example, in the above case, the right Y-axes of plot2, plot4, and hostPlot cannot be aligned because the axis widgets of plot2 and plot4 are not visible.
Figure Overlay
QwtFigureWidgetOverlay is an overlay class specifically designed for QwtFigure, inheriting from QwtWidgetOverlay. This class provides interactive operations on sub-plot components within a QwtFigure at runtime, including resizing plot components and selecting the currently active plot.
Key Features
- Plot Component Resizing: Users can resize and reposition sub-plot components within
QwtFigureby dragging with the mouse - Current Plot Selection: Supports selecting the currently active plot component via mouse click or keyboard shortcuts
- Visual Feedback: Provides clear visual feedback during operations, including borders, control points, and dimension information
The overlay's different functions can be controlled via the BuiltInFunctionsFlag enum:
1 2 3 4 5 | |
Use the setBuiltInFunctionsEnable() method to dynamically enable or disable these functions.
The overlay provides the following methods to customize its appearance:
setBorderPen()- Set the border pensetControlPointBrush()- Set the control point fillsetControlPointSize()- Set the control point sizeshowPercentText()- Control whether dimension percentage text is displayed
Usage
To use QwtFigureWidgetOverlay, simply create an instance and attach it to the target QwtFigure:
1 2 3 4 5 6 | |
The effect is shown below:
Specific functions can be enabled or disabled as needed:
1 2 3 4 5 | |
The overlay appearance can be customized to match the application's overall style:
1 2 3 4 5 6 7 8 9 10 11 | |
QwtFigureWidgetOverlay provides several useful signals to respond to user operations:
widgetNormGeometryChanged()- Emitted when the normalized geometry of a plot component changesactiveWidgetChanged()- Emitted when the currently active component changes
This overlay provides users with an intuitive, interactive way to manage and adjust multiple plot components within QwtFigure, improving user experience and operational efficiency.
Parasite Plot Example
Complete example code can be found in examples/figure