3D Plot Introduction
Qwt 7.1 integrates the original QwtPlot3D library, providing 3D data visualization capabilities. The 3D plot module supports surface plots, grid plots, function plots, and other types, suitable for 3D data display in scientific computing and engineering analysis.
Main Features
Features
- ✅ Multiple plot types: Surface plots, grid plots, parametric surfaces, etc.
- ✅ OpenGL rendering: High-performance 3D rendering using OpenGL
- ✅ Interactive operations: Supports mouse rotation, zooming, and panning
- ✅ Lighting and materials: Supports lighting effects and material configuration
- ✅ Theme system: One-click visual style switching with 10 preset themes and 22 scientific colormaps
3D Plot Module Structure
classDiagram
    class Plot3D {
        +setCoordinateStyle()
        +setPlotStyle()
        +setRotation()
        +setScale()
        +updateData()
        +enableMouse()
        +showColorLegend()
        +setDataColor()
    }

    class SurfacePlot {
        +loadFromData()
        +setResolution()
    }

    class Function {
        +operator(x,y)
        +create()
        +setDomain()
        +setMesh()
    }

    Plot3D <|-- SurfacePlot
    Plot3D --> Function : uses
Namespace
All 3D classes live in the Qwt3D namespace. Below they are shown without the
Qwt3D:: prefix for brevity — qualify them (or add using namespace Qwt3D;) in your code.
Core Classes
| Class Name | Description |
|---|---|
Qwt3D::Plot3D |
3D plot base class, provides basic framework and interaction |
Qwt3D::SurfacePlot |
3D surface plot, displays continuous surfaces (handles both grid and cell data) |
Qwt3D::Function |
3D function plot, generates surfaces from mathematical functions |
Qwt3D::GraphPlot |
Intermediate base class for graph-based 3D plots |
Qwt3D::Axis |
3D axis configuration |
Qwt3D::ColorLegend |
3D color bar |
Qwt3D::Qwt3DTheme |
3D theme system, encapsulates background, mesh, colormap, axes, lighting, and all visual attributes |
Usage
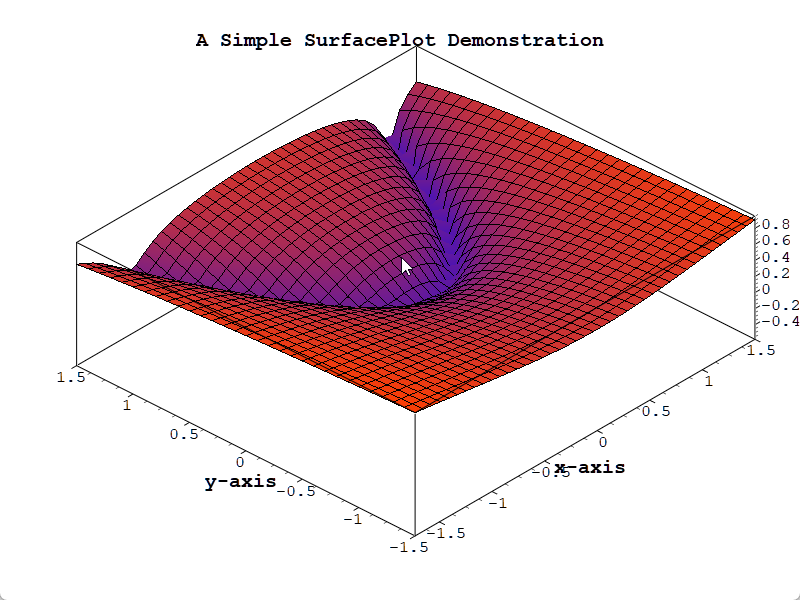
The 3D plot example is located at: examples/3D/simpleplot3D. Screenshot:
Basic Usage Example
1 2 3 4 5 6 7 8 9 10 11 12 13 14 15 16 17 18 19 20 21 22 23 24 25 26 27 28 29 30 31 32 33 | |
Data Loading
1 2 3 4 5 6 7 8 9 10 11 12 13 14 15 16 17 18 | |
Interactive Operations
1 2 3 4 5 6 7 8 9 10 11 12 13 | |
Color Mapping
1 2 3 4 5 6 7 8 9 | |
Theme System (v7.3.1+)
The Qwt3D::Qwt3DTheme class provides one-click switching of 3D plot visual styles, encapsulating all visual attributes including background color, mesh color, data colormap, axis colors, title styling, lighting presets, and shading modes.
Built-in Preset Themes
| Preset Name | Description |
|---|---|
Default |
White background + jet colormap + no lighting |
Dark |
Dark gray background + viridis + soft lighting |
Scientific |
White background + jet + studio lighting |
Warm |
Warm-toned background + hot colormap |
Cool |
Cool-toned background + cool colormap |
Matplotlib |
matplotlib style (viridis + soft lighting) |
EarthTones |
Earth tones + autumn colormap |
Ocean |
Ocean tones + winter colormap |
HighContrast |
Black background with white lines for high contrast |
Presentation |
Large fonts + thick lines, suitable for presentations |
Usage Examples
1 2 3 4 5 6 7 8 9 10 11 12 13 14 | |
Colormap Presets
Qwt3D::Qwt3DTheme provides 22 scientific visualization colormaps via the core module's QwtColorMapPreset:
- Perceptually uniform:
viridis,plasma,inferno,magma,cividis - Classic:
jet,hot,cool,spring,summer,autumn,winter - Grayscale:
gray,bone,copper - Rainbow:
rainbow,hsv,turbo - Diverging:
coolwarm,rdylbu,rdylgn,spectral
1 2 3 4 5 | |
Lighting Presets
| Preset | Description |
|---|---|
NoLighting |
No lighting, solid color rendering |
FlatLight |
Uniform ambient light |
Studio |
Classic three-point lighting |
Outdoor |
Strong directional light + ambient |
Soft |
Soft diffuse lighting |
Build Configuration
To use 3D features, enable the QWT_CONFIG_QWTPLOT_3D CMake option:
1 2 3 4 5 6 7 | |
OpenGL Dependency
The 3D plot module depends on OpenGL and GLU libraries. Ensure that OpenGL drivers and GLU library are installed on your system.
Core Method Summary
| Method | Class | Description |
|---|---|---|
setDomain() |
Qwt3D::Function / Qwt3D::GridMapping |
Set X/Y data range |
setMesh() |
Qwt3D::Function / Qwt3D::GridMapping |
Set grid resolution (columns, rows) |
setResolution() |
Qwt3D::SurfacePlot |
Set data resolution (1 = all data) |
loadFromData() |
Qwt3D::SurfacePlot |
Load data array into the plot |
create() |
Qwt3D::Function |
Generate and attach surface data |
setRotation() |
Qwt3D::Plot3D |
Set rotation angles |
setScale() |
Qwt3D::Plot3D |
Set scale ratio |
enableMouse() |
Qwt3D::Plot3D |
Enable/disable mouse interaction |
showColorLegend() |
Qwt3D::Plot3D |
Show/hide color legend |
setDataColor() |
Qwt3D::Plot3D |
Set data color functor |
updateData() |
Qwt3D::Plot3D |
Recalculate and update data |
3D Plot Recommendations
- Data size should not be too large (recommended under 100x100 grid)
- For complex surfaces, reduce resolution to improve performance
- Use lighting effects to enhance visual appearance
Related Examples
- Basic 3D plot:
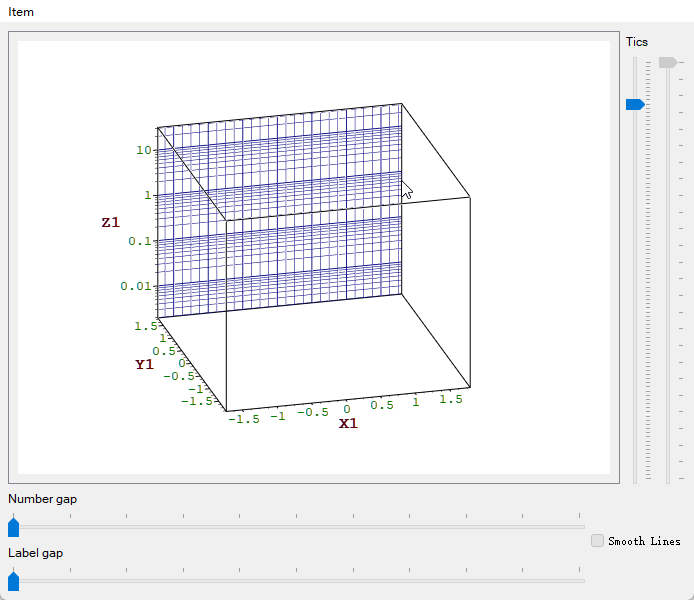
examples/3D/simpleplot3D - 3D axis configuration:
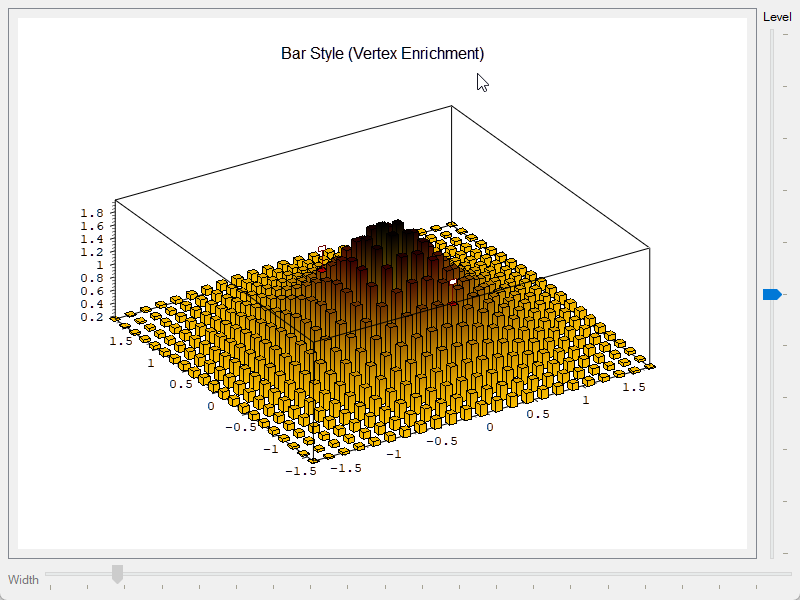
examples/3D/axes - 3D enrichments:
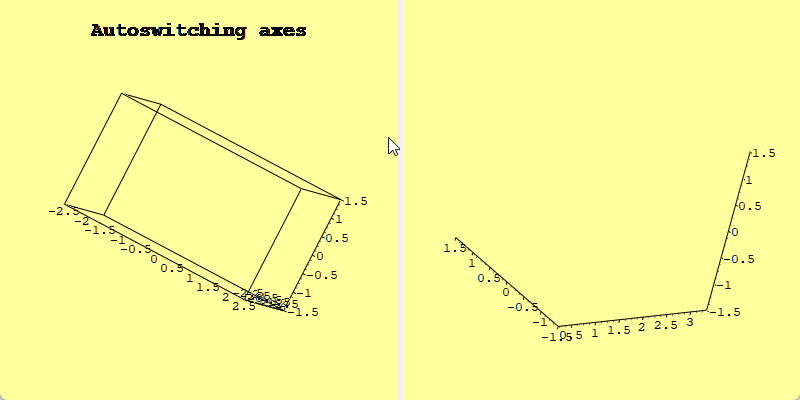
examples/3D/enrichments - 3D auto switch:
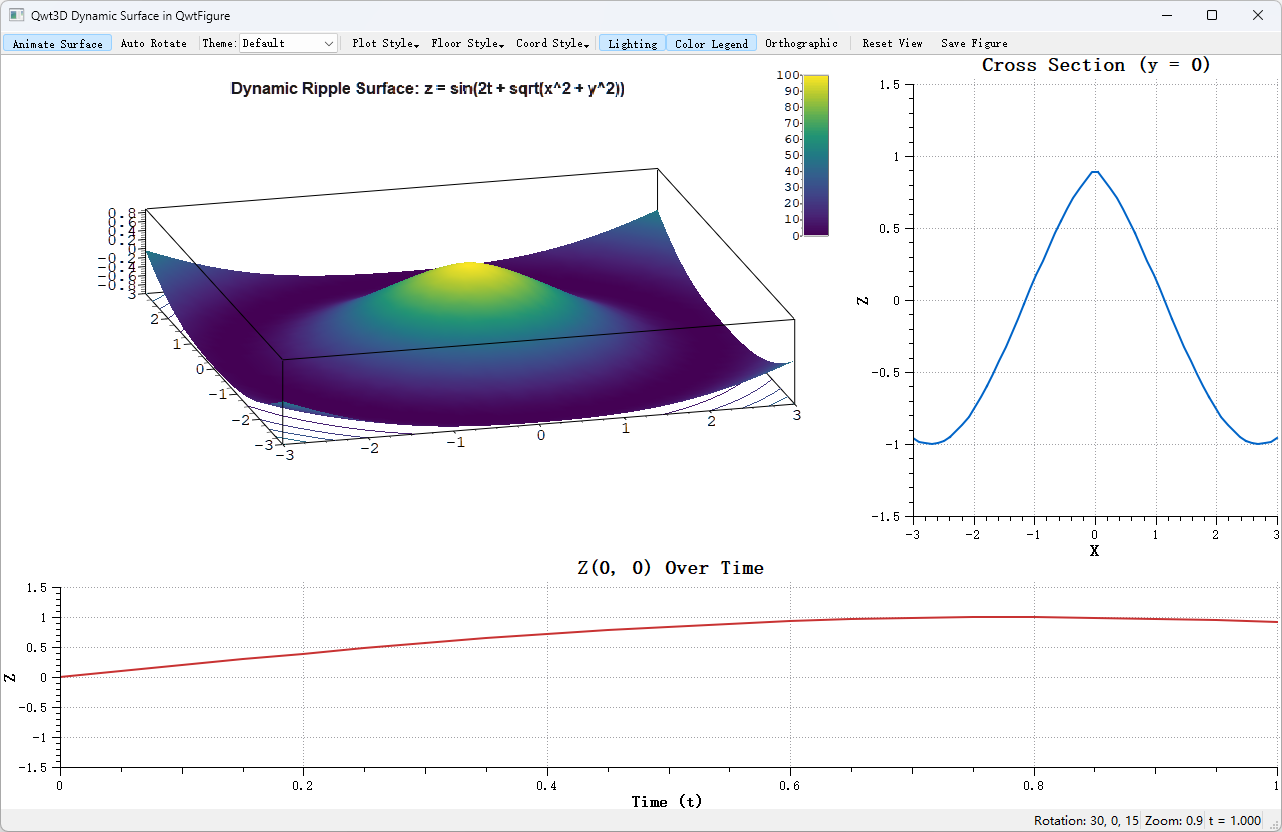
examples/3D/autoswitch - Dynamic 3D surface (QwtFigure integration):
examples/3D/figureSurface3D
Screenshots of 3D axis configuration, 3D enrichments, 3D auto switch, and dynamic 3D surface: