Open Source · LGPL Licensed
Qt Plotting Library
A high-performance 2D/3D plotting library for Qt applications, designed for scientific computing and engineering data visualization.
Core Features
Everything you need for professional data visualization in Qt applications.
High Performance
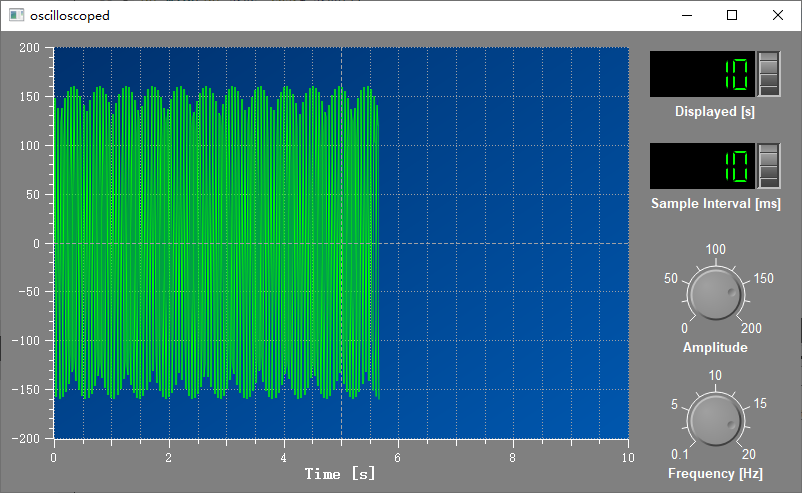
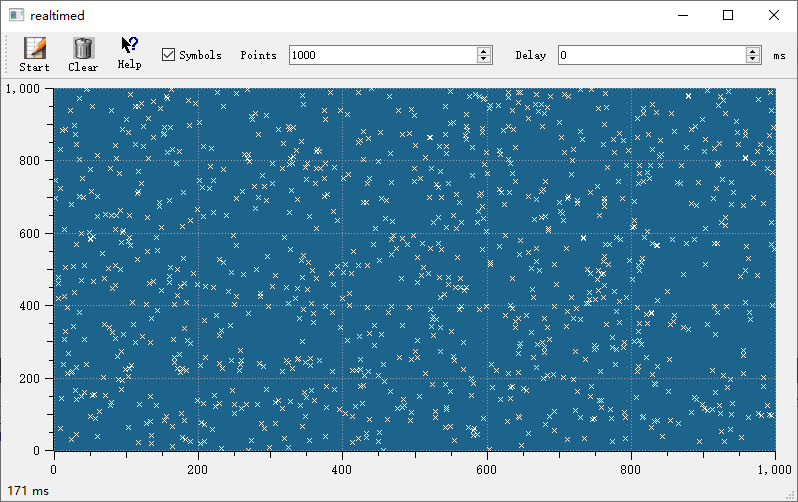
Optimized QPainter rendering pipeline for large-scale datasets. Smooth real-time plotting with efficient redraw strategies.
Rich Chart Types
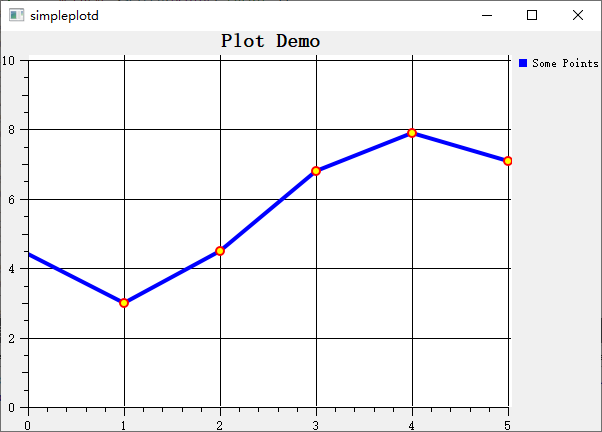
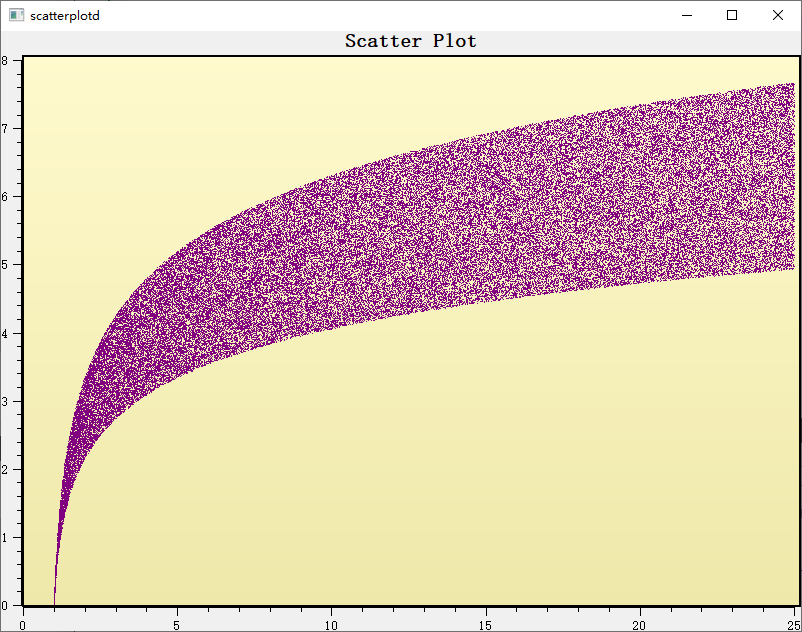
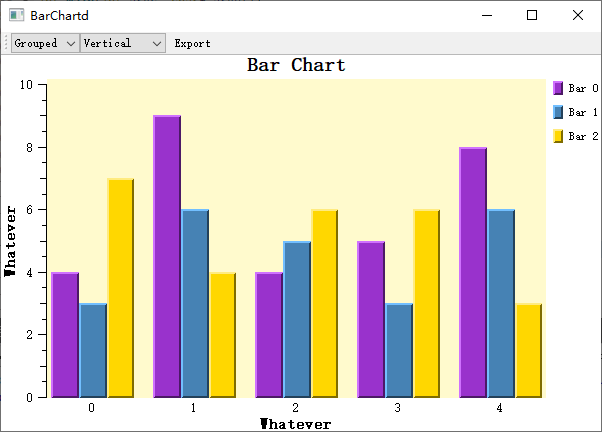
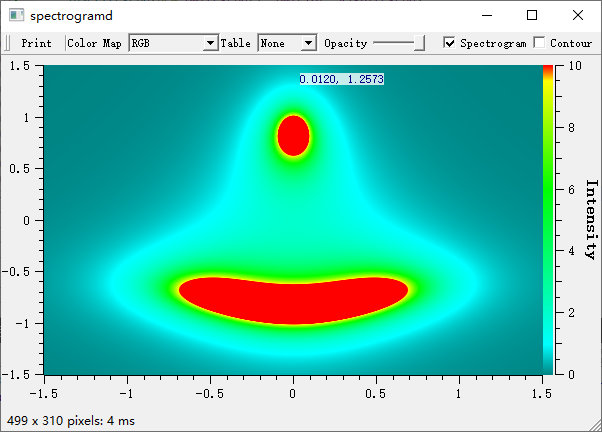
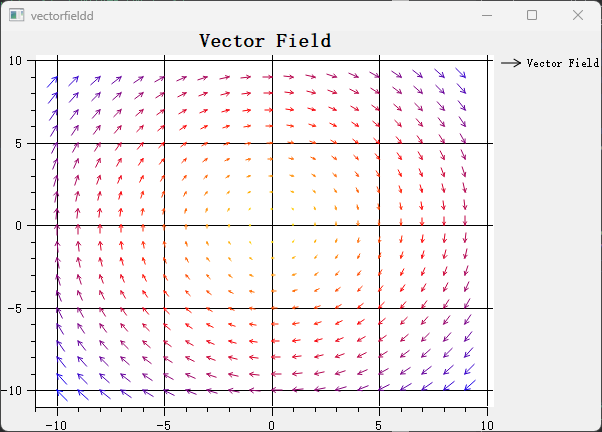
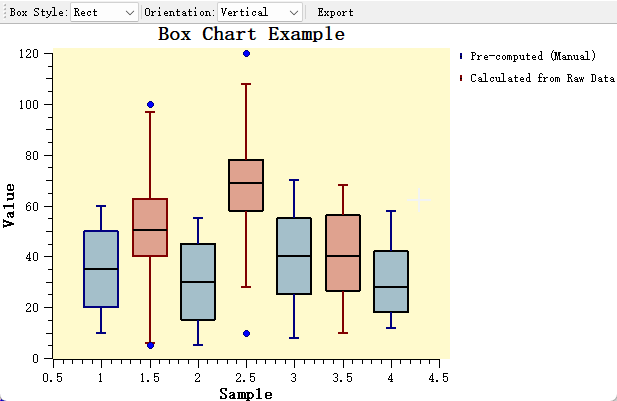
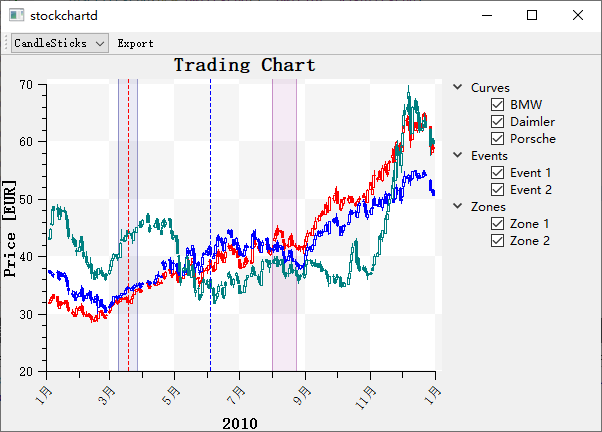
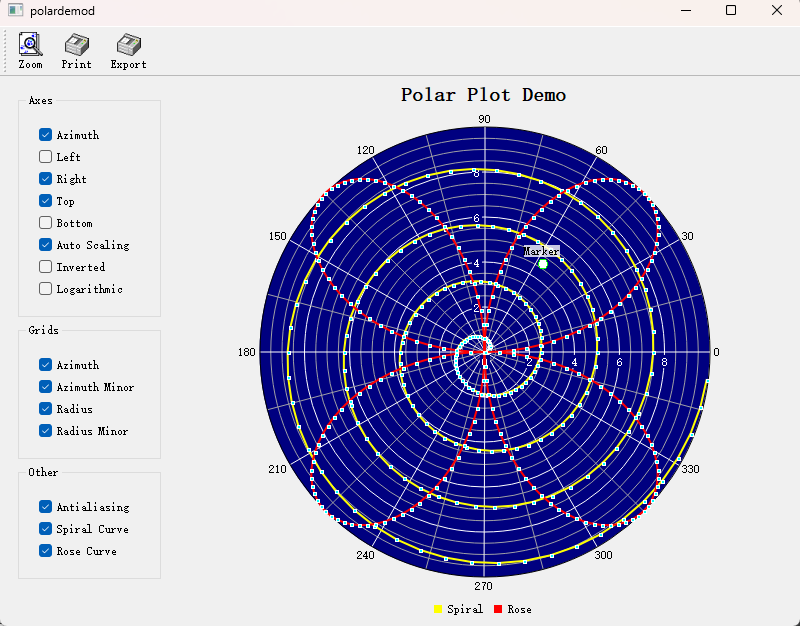
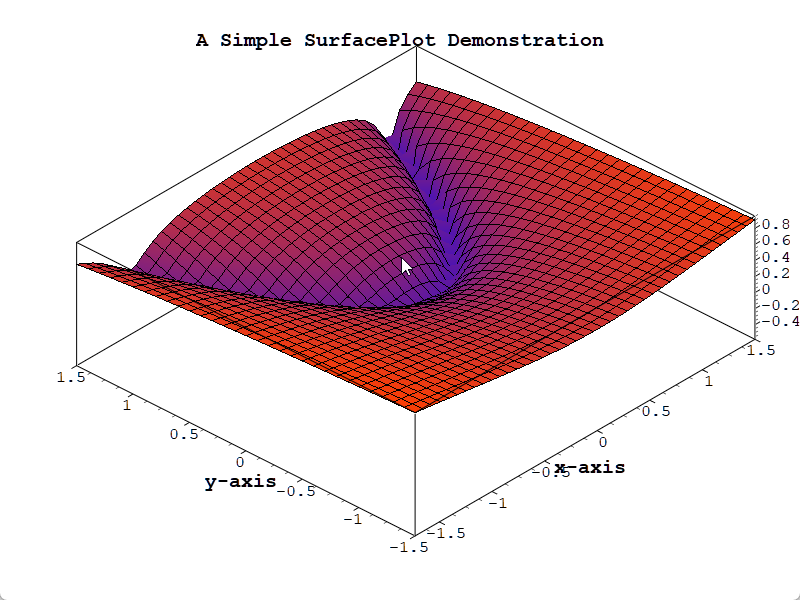
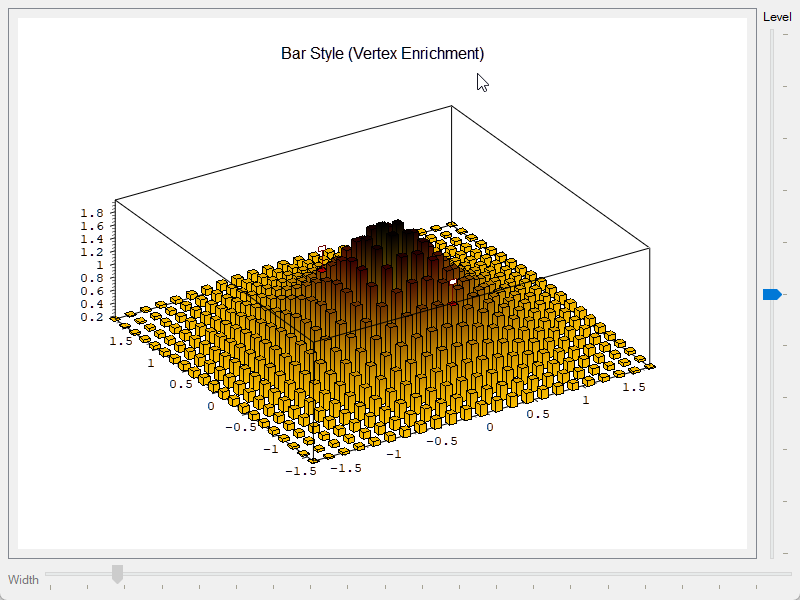
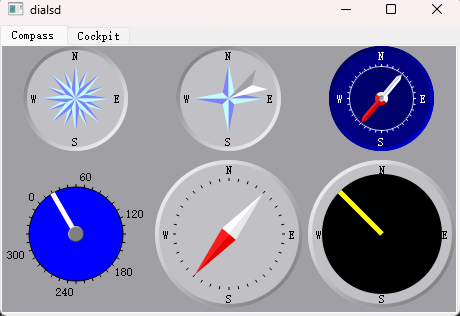
20+ built-in chart types: curves, scatter, bar, box, histogram, spectrogram, K-line, vector field, polar plots, and 3D surfaces.
CMake & Qt6
Full CMake support with find_package(qwt). Single-file amalgamation available. Compatible with Qt 5.12+ and Qt 6.
Multi-Axis System
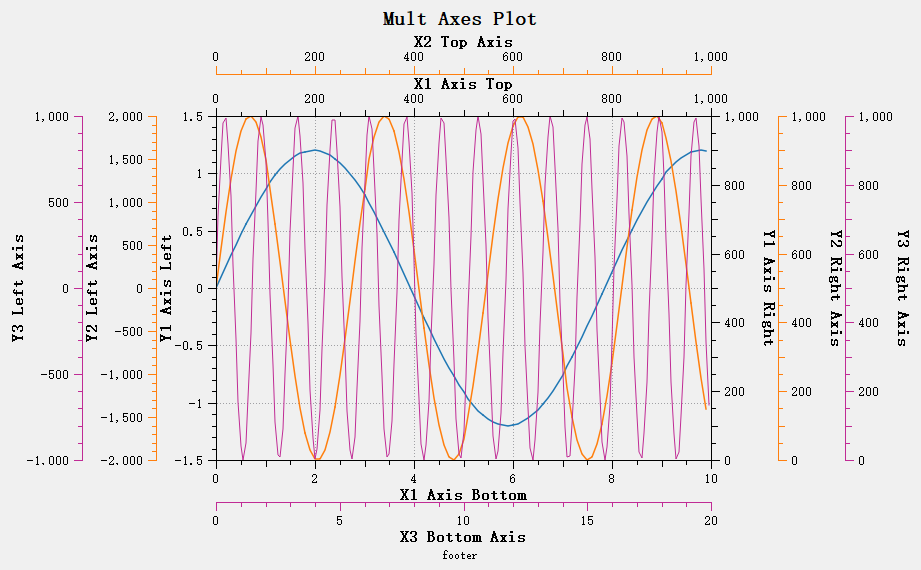
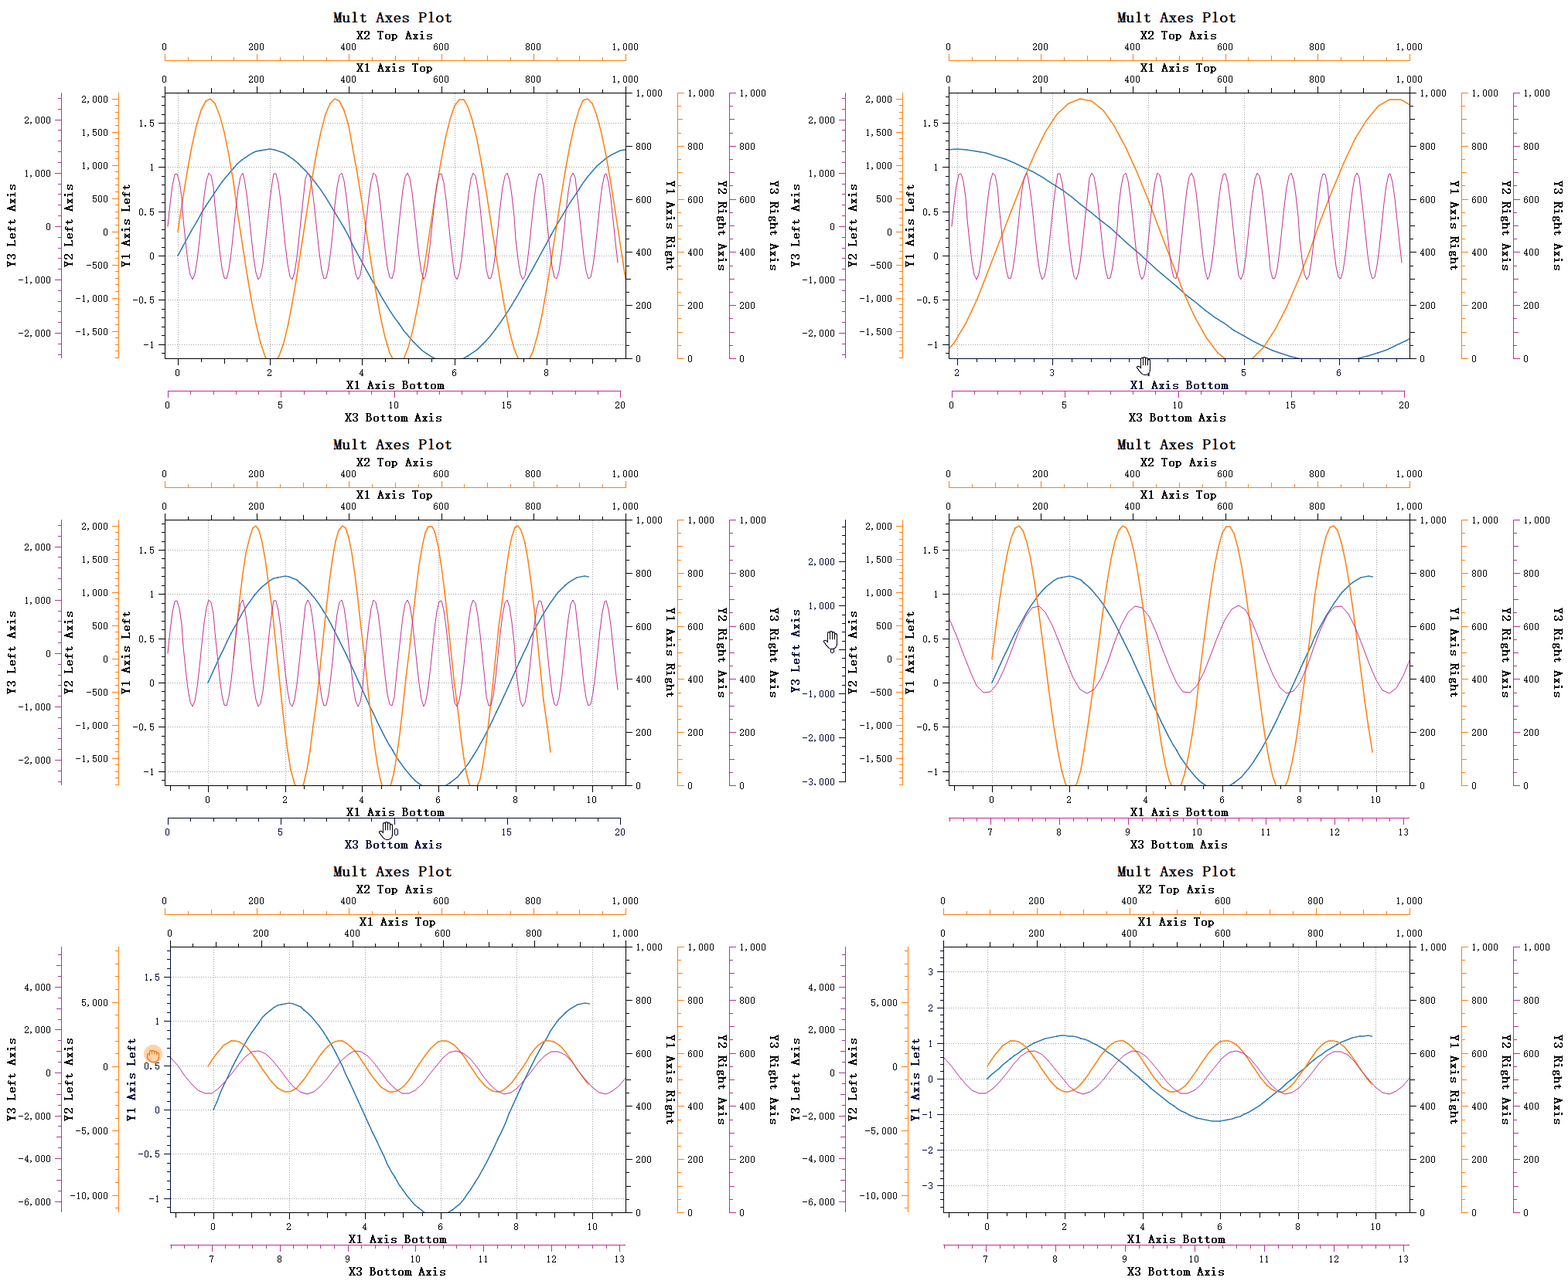
Create unlimited independent axes via parasite plot architecture — similar to matplotlib's twin axis system with full interaction support.
Modern Design
Clean, flat visual style replacing the legacy embossed look. Professional aesthetics that fit contemporary application design.
Figure Layout
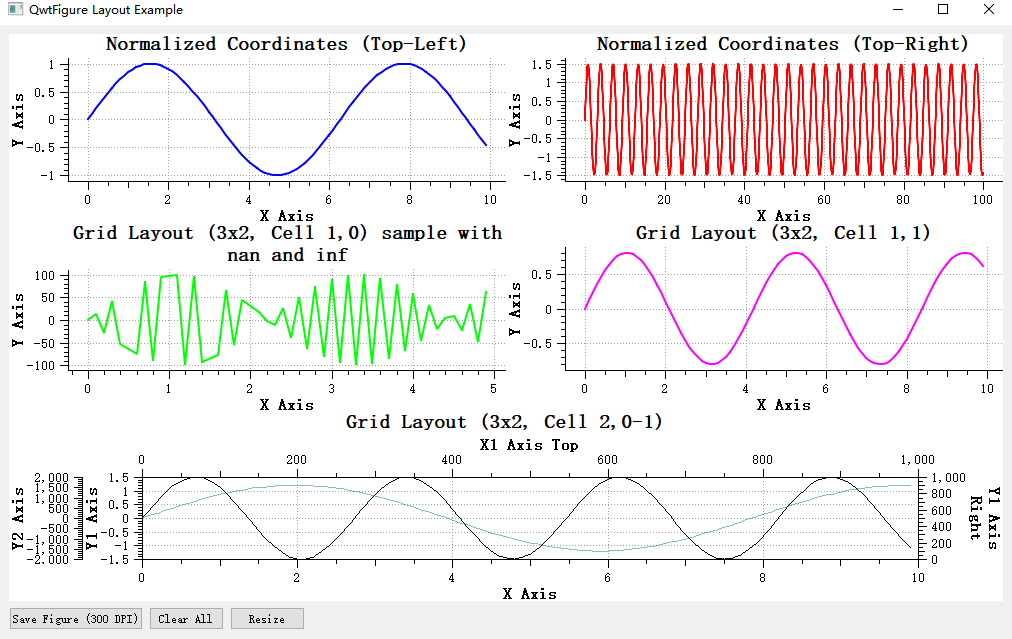
matplotlib-inspired QwtFigure for multi-plot grid layouts. Interactive drag, resize, and manage subplots with overlay widgets.
Visualization Showcase
From basic charts to advanced scientific visualizations.
Quick Start
Integrate QWT into your project in minutes.
1 2 3 4 5 6 | |
1 2 3 4 5 6 7 8 | |
1 2 3 4 5 6 7 8 9 10 11 12 13 14 | |