First Plot - Getting Started with QwtPlot
This tutorial will help you quickly get started with the Qwt plotting library by walking through a simple example that demonstrates the basic usage of QwtPlot.
QwtPlot Basic Concepts
QwtPlot is the core class of the Qwt plotting library. It is a Qt widget for rendering 2D graphics. A QwtPlot can contain multiple plot items such as curves, grids, markers, etc. All plot items must be attached to the QwtPlot via the attach() method to be displayed.
Plot Item Types
classDiagram
    class QwtPlotItem {
        +attach(plot)
        +detach()
        +setTitle()
        +setItemAttribute()
    }

    class QwtPlotCurve {
        +setSamples()
        +setPen()
        +setSymbol()
        +setStyle()
    }

    class QwtPlotGrid {
        +enableX()
        +enableY()
        +setMajorPen()
        +setMinorPen()
    }

    class QwtPlotMarker {
        +setValue()
        +setLineStyle()
        +setLabel()
    }

    class QwtPlotBarChart {
        +setSamples()
        +setLayoutPolicy()
        +setSymbol()
    }

    QwtPlotItem <|-- QwtPlotCurve
    QwtPlotItem <|-- QwtPlotGrid
    QwtPlotItem <|-- QwtPlotMarker
    QwtPlotItem <|-- QwtPlotBarChart
Axis System
QwtPlot provides four axis positions by default:
| Axis Position | Enum Value | Description |
|---|---|---|
| Bottom X-axis | QwtAxis::XBottom |
Visible by default |
| Top X-axis | QwtAxis::XTop |
Hidden by default |
| Left Y-axis | QwtAxis::YLeft |
Visible by default |
| Right Y-axis | QwtAxis::YRight |
Hidden by default |
Basic Usage Workflow
The basic steps for creating a plot with QwtPlot are as follows:
flowchart TD
    A[Create QwtPlot object] --> B[Set title and style]
    B --> C[Create plot items]
    C --> D[Set plot item properties and data]
    D --> E[Attach to QwtPlot]
    E --> F[Set axis ranges]
    F --> G[Refresh display with replot]
Simplest Example
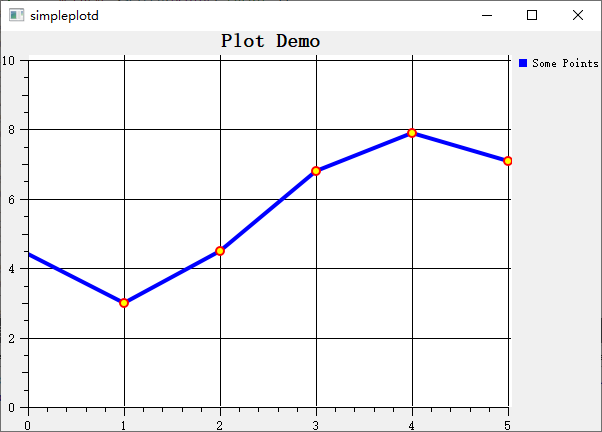
The following example demonstrates the most basic usage of QwtPlot:
The simple plot example is located at: examples/2D/simpleplot. A screenshot is shown below:
Complete Code
1 2 3 4 5 6 7 8 9 10 11 12 13 14 15 16 17 18 19 20 21 22 23 24 25 26 27 28 29 30 31 32 33 34 35 36 37 38 39 40 41 42 43 44 45 46 47 48 49 50 51 52 53 54 | |
Code Walkthrough
1. Creating the Plot Window
1 2 3 | |
QwtPlot is the main container for the plot, inheriting from QFrame. The canvas background color determines the base color of the plot area. It is recommended to use white or a light color for clear data display.
2. Adding a Grid
1 2 | |
The grid is a standalone plot item used to display coordinate reference lines. All plot items are attached to QwtPlot via the attach() method, and QwtPlot automatically manages the lifecycle of attached items.
Plot Item Lifecycle
Once a plot item is attached to QwtPlot, QwtPlot holds a reference to that item. When QwtPlot is destroyed, all attached plot items are automatically deleted as well. Therefore, you do not need to manually manage the memory of plot items.
3. Creating a Curve and Setting Its Style
1 2 3 4 | |
Curves are the most commonly used plot item type:
- setTitle() sets the curve title, which is displayed in the legend
- setPen() sets the line color, width, and style
- setRenderHint() enables anti-aliased rendering for smoother lines
4. Setting Data Point Symbols
1 2 3 4 5 6 7 | |
Symbols are used to display markers at each data point position. QwtSymbol supports various shapes:
- Ellipse - Ellipse/Circle
- Rect - Rectangle
- Diamond - Diamond
- Triangle - Triangle
- Cross - Cross
- XCross - X-shaped cross
5. Setting Curve Data
1 2 3 | |
The setSamples() method is used to set the data points of the curve. Qwt provides multiple ways to set data:
| Method | Description |
|---|---|
setSamples(const QPolygonF&) |
Set from a QPointF array |
setSamples(const QVector<double>& x, const QVector<double>& y) |
Set from two arrays |
setSamples(const double* x, const double* y, int size) |
Set from raw arrays |
setRawSamples(const double* x, const double* y, int size) |
Directly reference external arrays (no copy) |
setRawSamples Caveats
When using setRawSamples(), Qwt does not copy the data but directly references the arrays you provide. This means you must ensure the arrays remain valid for the lifetime of the curve and must not modify the array contents.
6. Setting Axes
1 | |
setAxisScale() is used to manually set the axis range. If this method is not called, Qwt automatically calculates an appropriate range based on the data of the attached plot items.
Advanced Configuration
Multiple Curves
1 2 3 4 5 | |
A single QwtPlot can have any number of plot items attached, and they are drawn in the order they were attached.
Setting Axis Titles
1 2 | |
Auto-Replot Mode
1 | |
When auto-replot is enabled, QwtPlot automatically calls replot() to update the display whenever a plot item's data or properties change. By default, you need to manually call replot() to refresh the plot.
Performance Tip
For real-time update scenarios, it is recommended to disable auto-replot and manually call replot() once after batch updates are complete. This avoids the performance overhead of frequent refreshes.
QwtPlot Core Methods
| Method | Description |
|---|---|
setTitle() |
Set the plot title |
setCanvasBackground() |
Set the canvas background color |
setAxisScale() |
Set the axis range |
setAxisTitle() |
Set the axis title |
insertLegend() |
Insert a legend |
replot() |
Refresh the plot display |
setAutoReplot() |
Set auto-replot mode |
exportPlot() |
Export the plot to a file |
Related Examples
- Basic plot:
examples/2D/simpleplot - Curve style demo:
examples/2D/curvedemo - Real-time data:
examples/2D/cpuplot