Data Picking
The data picking feature is a common requirement for plot controls, allowing users to display the specific values at the current mouse position as the mouse moves.
Qwt7 adds the QwtPlotSeriesDataPicker class, which provides real-time display of data point information as the mouse moves over the plot area. This class supports two picking modes: Y-value picking mode and nearest-point picking mode, significantly enhancing the interactive experience for data visualization and analysis.
Features
- ✅ Dual-mode picking: Supports both Y-value picking and nearest-point picking modes
- ✅ Smart interpolation: Supports linear interpolation calculation for precise values between data points
- ✅ High-performance optimization: Uses binary search and window optimization algorithms for nearest-point picking on large datasets
- ✅ Multi-curve support: Handles data picking for multiple curves simultaneously
- ✅ Customizable display: Customizable text style, feature point drawing, and background
- ✅ Parasite plot support: Supports data retrieval from both host plots and parasite plots
Header inclusion:
1 | |
Effect:
Basic Usage
QwtPlotSeriesDataPicker inherits from QwtPlotPicker. To create a picker, simply pass the plot's canvas area. Example code:
1 2 3 4 5 6 7 8 9 10 11 12 13 14 | |
Picking Mode Settings
QwtPlotSeriesDataPicker provides two picking modes, which can be set via the setPickMode function. The picking mode enum is as follows:
1 2 3 4 5 | |
Y-Value Picking Mode
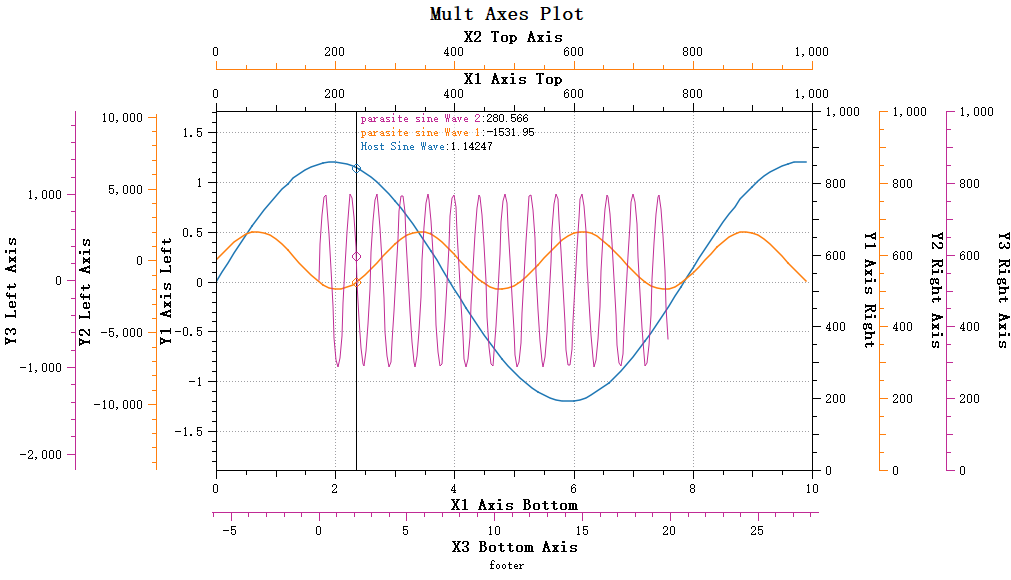
Y-value picking mode (QwtPlotSeriesDataPicker::PickYValue) displays the Y values of all curves at the current X position.
1 2 | |
Y-value picking mode effect:
In Y-value picking mode, you can set whether to perform interpolation calculation via the setInterpolationMode method. Interpolation calculation can improve data accuracy. If points are sparse, the Y value corresponding to the current X position is calculated using linear interpolation.
Note
Interpolation is enabled by default.
1 2 | |
Nearest-Point Picking Mode
Nearest-point picking mode (QwtPlotSeriesDataPicker::PickNearestPoint) calculates and picks the point closest to the mouse. This mode is especially suitable for picking peak data in plots such as spectrum plots.
1 2 | |
Nearest-point picking mode effect:
Nearest-point picking requires calculating the distance from curve points to the mouse position. Traversing the entire curve would be very time-consuming, so Qwt7 provides a window search algorithm that can quickly find the data point closest to the mouse.
Set the search window size via the setNearestSearchWindowSize method:
1 2 3 4 | |
The search window can be set in the following ways:
- 0: No window, search the entire curve
- Positive number: Fixed window size (number of data points)
- Negative number: Adaptive window, using a percentage of the total curve data points (absolute value, e.g., -5 means 5%)
The default search window size is -5, meaning 5% of the curve points.
Note
The default threshold for enabling the window search algorithm in Qwt7 is 1000 data points, meaning the window setting only takes effect when the curve has more than 1000 points.
Notes
The window optimization algorithm requires curve data to be sorted in ascending order by X coordinate. If using a custom data source, ensure the data is properly sorted.
Other Property Settings
Text Display Settings
QwtPlotSeriesDataPicker allows setting the text display position. The text display position is defined by the enum QwtPlotSeriesDataPicker::TextPlacement. You can use the setTextArea function to set where the text is placed. The default is automatic selection, which intelligently chooses based on the picking mode.
You can set the text alignment style and background color via the following methods:
1 2 3 4 | |
Bug
The drawing area of QwtPlotSeriesDataPicker is the layer of the host plot. Parasite plots are child windows of the host plot, so graphics drawn by parasite plots overlay the host plot. This means curves displayed by parasite plots appear above the drawing area of QwtPlotSeriesDataPicker. The current parasite plot architecture cannot make QwtPlotSeriesDataPicker content appear above parasite plots.
Feature Point Drawing
Points picked by QwtPlotSeriesDataPicker are called feature points. Feature points are marked on the curve. You can set the feature point drawing style via the following methods:
1 2 3 4 5 | |
Customization
Custom Display Text
The displayed text content can be customized by inheriting QwtPlotSeriesDataPicker and overriding the valueString method to customize the display format of data points:
Here is an example:
1 2 3 4 5 6 7 8 9 10 11 12 13 14 15 16 17 18 19 20 21 22 23 | |
The order parameter of the valueString method represents the nth feature point being displayed. If you have multiple curves, this parameter increments. You can use this parameter to determine whether to insert a line break (when it is 0).
Click Signals
QwtPlotSeriesDataPicker provides click signals to respond to user mouse click operations.
Signal Description
1 2 3 4 5 | |
Signal Parameters:
| Parameter | Type | Description |
|---|---|---|
| picker | QwtPlotSeriesDataPicker* | Pointer to the clicked picker |
| pos | QPoint | Screen position of the click event |
Left Button Only
Note
Click signals only respond to the left mouse button (Qt::LeftButton). Right-click and middle-click do not trigger these signals.
Double-Fire Behavior
Note
When the user double-clicks, the clicked() signal is fired first, followed by the doubleClicked() signal.
This is standard Qt behavior, not a bug.
If you need to distinguish between single-click and double-click, it is recommended to connect only one of the signals, not both.
Getting Picked Data
You can get the currently picked data point information via the featurePoints() method.
FeaturePoint Structure
1 2 3 4 5 6 | |
Field Description:
| Field | Type | Description |
|---|---|---|
| item | QwtPlotItem* | Curve pointer, can get curve name via item->title().text() |
| feature | QPointF | Data point coordinate values (x, y) |
| index | size_t | Index position of the data point in curve samples |
featurePoints() Method
1 2 | |
featurePoints() returns all feature points picked at the current tracker position. This method is typically called in clicked or doubleClicked signal handlers to get data at the click position.
Tip
The returned list may contain multiple FeaturePoint entries, as the mouse position may correspond to data points from multiple curves simultaneously (especially in Y-value picking mode).
Group Signal Forwarding
QwtPlotSeriesDataPickerGroup provides click signal forwarding within the group.
Group Signal Description
1 2 3 4 5 | |
Sync-Before-Signal
Important Feature
Before emitting click signals, the Group synchronizes the positions of all other pickers in the group.
This means when the clicked signal fires, featurePoints() of all pickers in the group have already been updated to the synchronized position.
This feature is very useful for multi-subplot linked scenarios: when the user clicks a subplot, the pickers in other subplots have already been synchronized to the corresponding proportional X-axis position, allowing direct retrieval of data from all subplots at the same proportional position.
Code Example
The following example demonstrates how to connect Group click signals and retrieve picked data:
1 2 3 4 5 6 7 8 9 10 11 12 13 14 15 16 17 18 19 20 21 22 23 24 25 26 27 28 29 30 31 | |
Multi-Subplot Linked Example
In a multi-subplot layout, cross-plot data inspection can be achieved through the Group's synchronization mechanism:
1 2 3 4 5 6 7 8 9 10 11 12 13 14 15 16 17 18 19 20 21 22 23 24 25 26 27 28 | |