Axis Widget - QwtScaleWidget
QwtScaleWidget is the display widget for axes, responsible for drawing tick marks, tick labels, and axis titles. It is a fundamental component of the QwtPlot axis system and also supports standalone use.
Main Features
Features
- ✅ Tick drawing: Draws major ticks, minor ticks, and tick labels
- ✅ Axis title: Supports displaying axis title text
- ✅ Outside axis title: Supports painting the title horizontally below/above the scale widget (
TitleOutside) - ✅ Built-in interaction: Supports mouse drag panning and scroll wheel zooming (new in Qwt7)
- ✅ Color bar: Supports displaying color bars (for spectrograms)
- ✅ Style customization: Customizable tick length, label font, etc.
Basic Concepts
Axis Position
Qwt uses the QwtAxis::Position enum to identify axis positions:
| Position | Enum Value | Description |
|---|---|---|
| Bottom X-axis | QwtAxis::XBottom |
Bottom horizontal axis |
| Top X-axis | QwtAxis::XTop |
Top horizontal axis |
| Left Y-axis | QwtAxis::YLeft |
Left vertical axis |
| Right Y-axis | QwtAxis::YRight |
Right vertical axis |
Axis Structure
1 2 3 4 5 6 7 | |
Usage
1. Setting Axes via QwtPlot
1 2 3 4 5 6 7 8 9 10 11 12 13 14 15 16 17 | |
2. Getting Axis Widget
1 2 3 4 5 6 7 8 9 10 11 12 13 14 | |
3. Built-in Interaction Features (New in Qwt7)
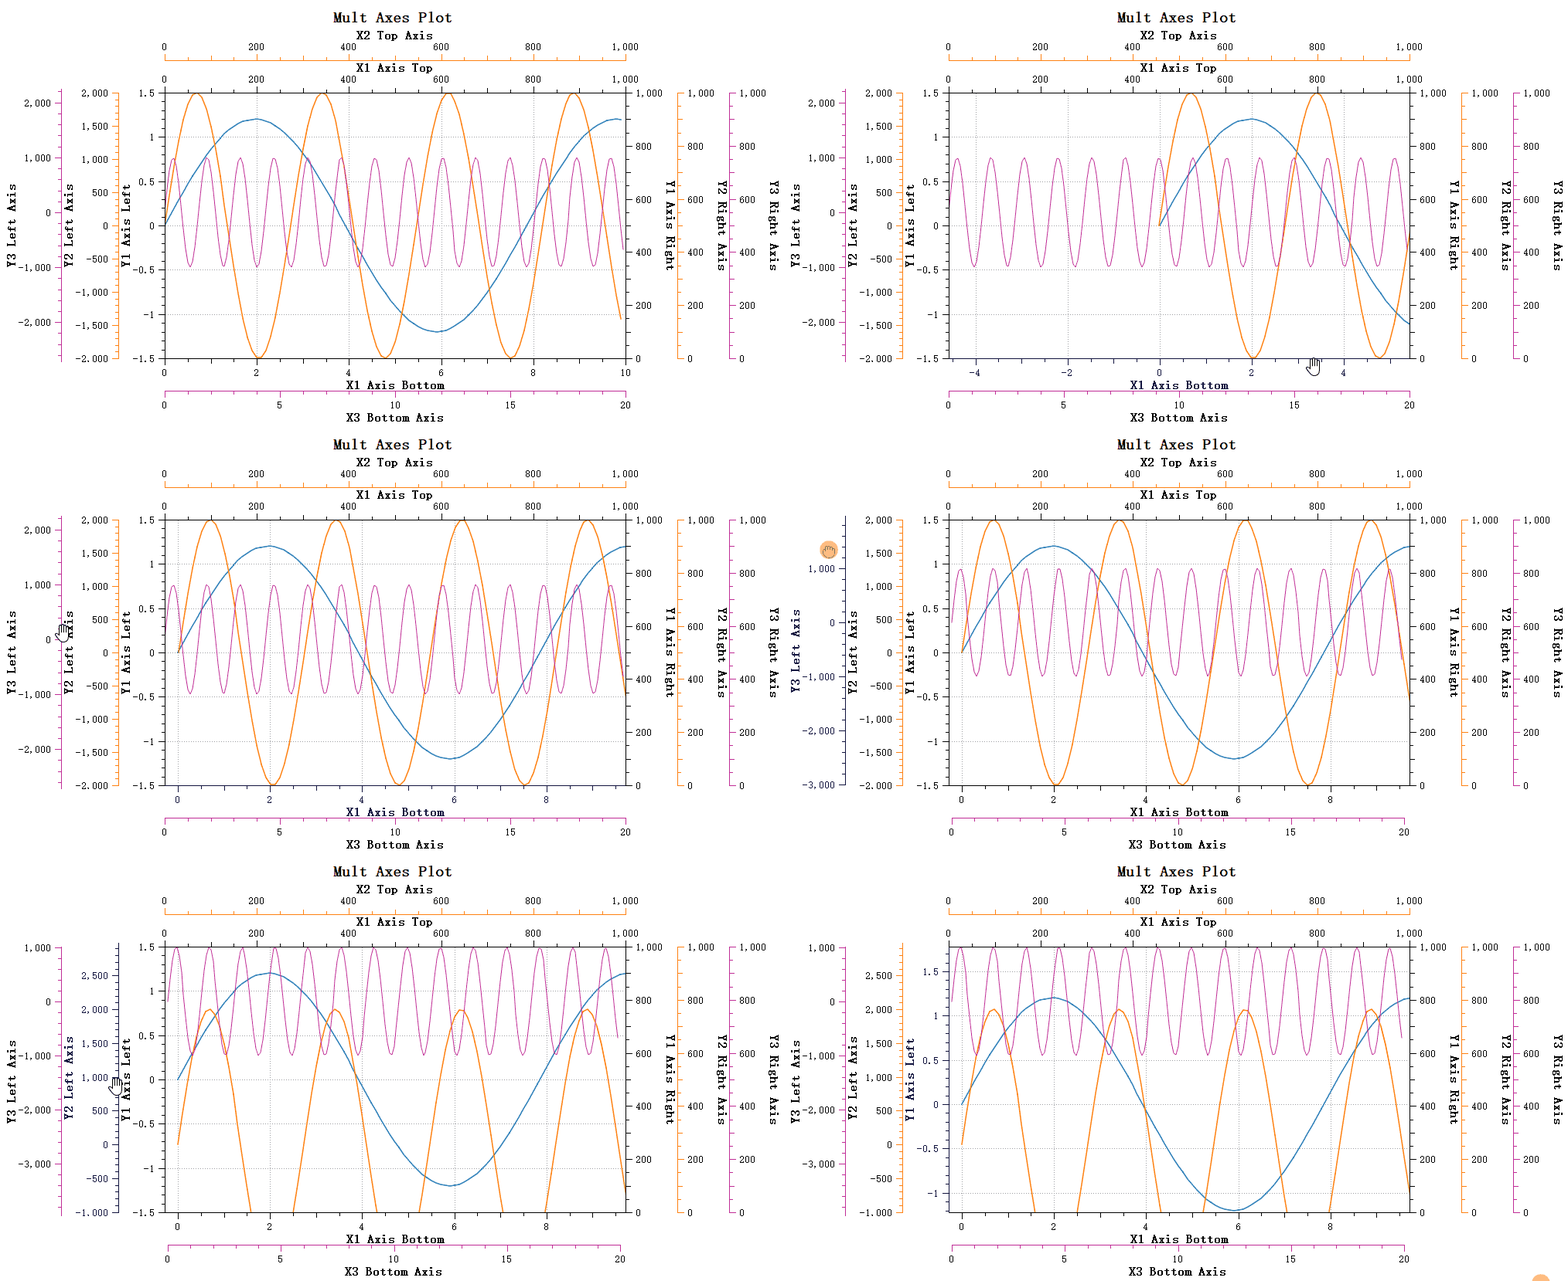
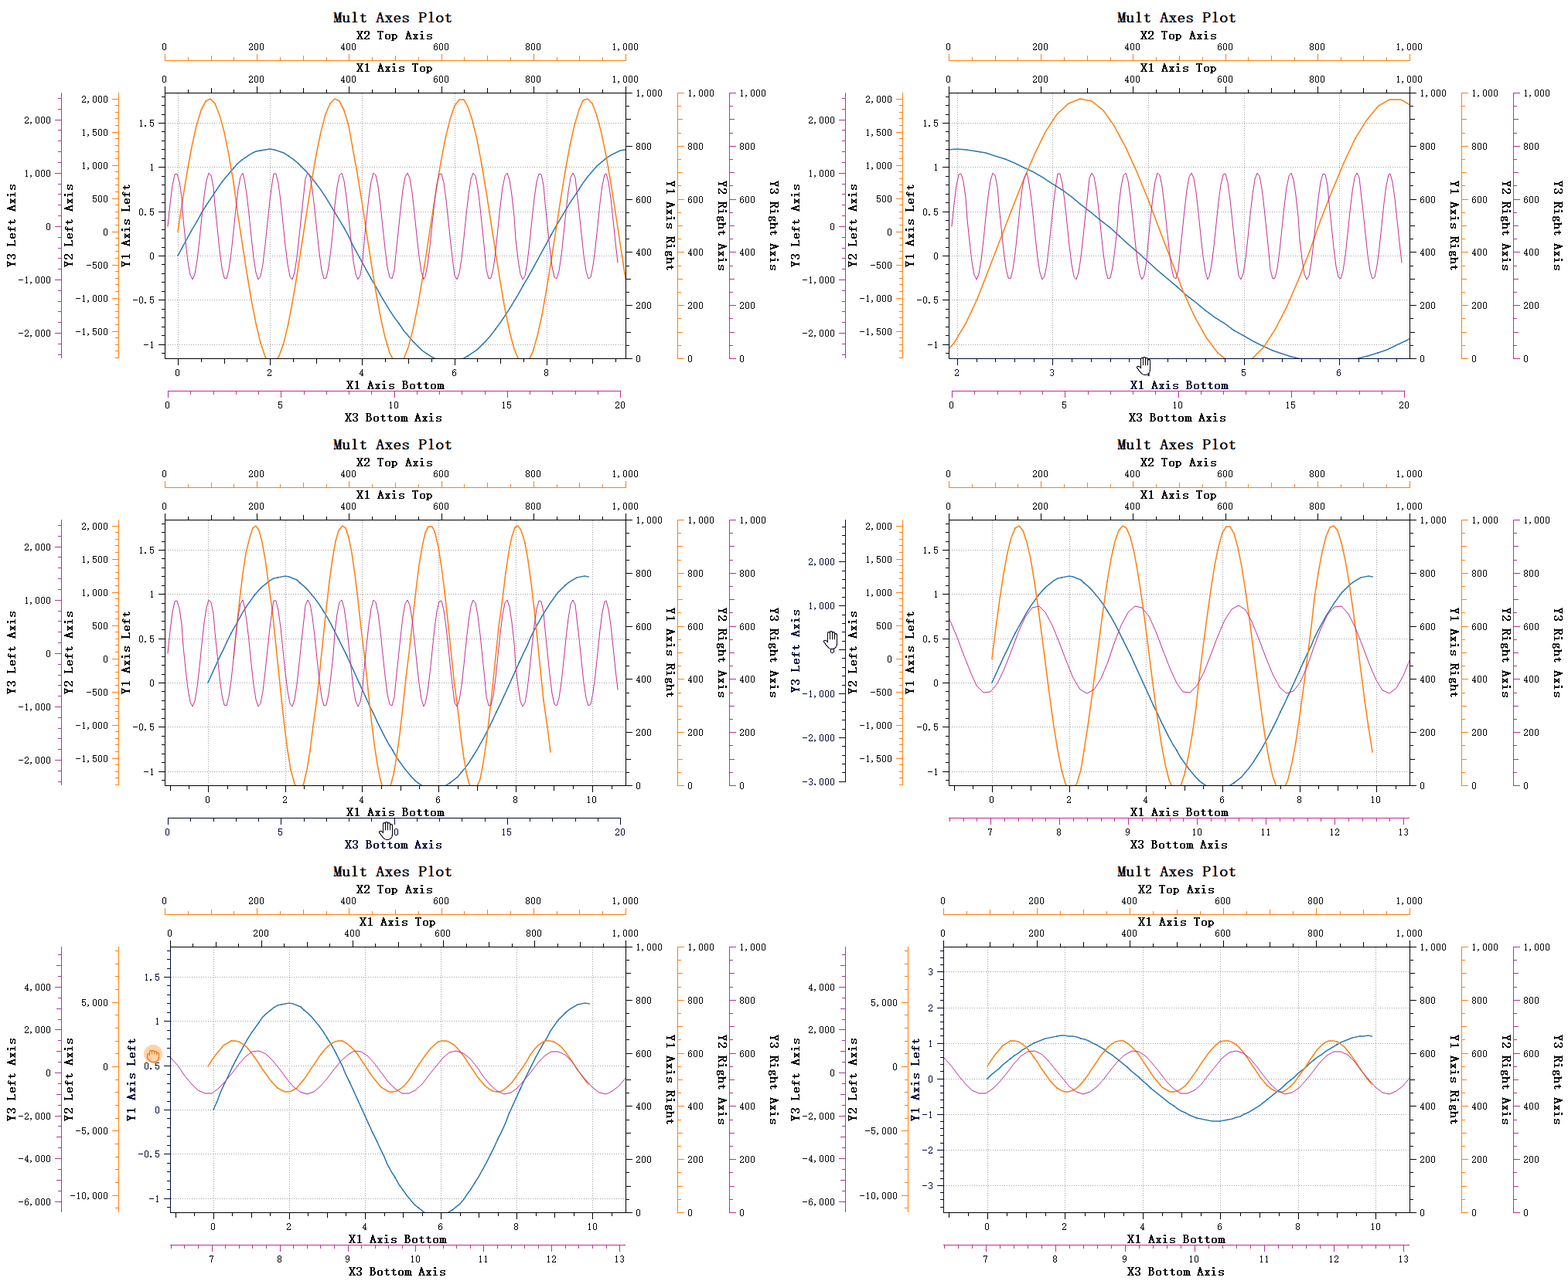
Qwt 7.0 adds built-in axis interaction features, supporting direct panning and zooming on axes:
1 2 3 4 5 6 7 8 9 10 11 12 | |
Panning effect:
Zooming effect:
For detailed axis interaction documentation, refer to: Axis Interaction Actions
4. Color Bar Display
Used for scenarios requiring color mapping such as spectrograms:
1 2 3 4 5 6 7 8 9 10 11 12 | |
5. Tick Drawing Style
1 2 3 4 5 6 7 8 9 10 | |
6. Tick Label Formatting
Customize tick label format by setting QwtScaleDraw:
1 2 3 4 5 6 7 8 9 10 11 12 13 14 15 | |
7. Setting Tick Division
1 2 3 4 5 6 7 8 9 10 11 12 13 14 | |
8. Outside Axis Titles (TitleOutside)
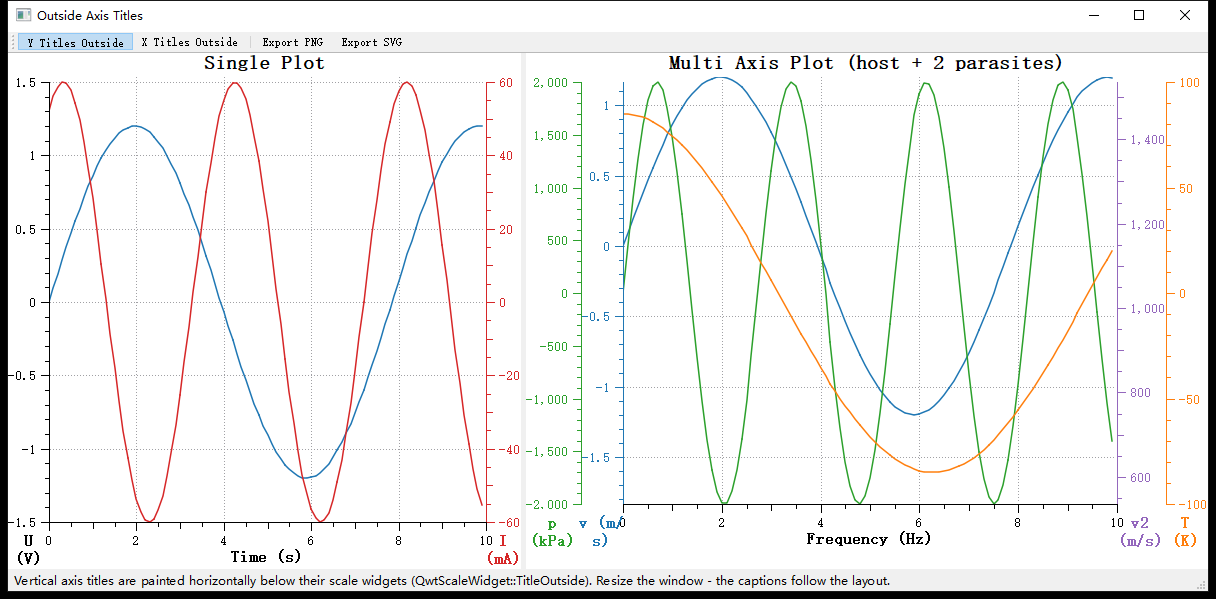
By default the axis title is painted inside the scale widget (rotated for vertical axes). With QwtScaleWidget::TitleOutside the title is painted as horizontal text into a caption strip outside the scale widget instead: directly below it for YLeft/YRight/XBottom and above it for XTop. The plot layout reserves the strip automatically and keeps it attached to the scale widget through every relayout (window resize, axis visibility or scale changes, ...).
1 2 3 4 5 6 7 8 9 10 11 12 13 14 15 16 | |
Effect (from the example examples/2D/outsideTitle; left: single plot, right: multi axis plot with parasite layers, every layer title below its own axis column):
Behavior notes
- In
TitleOutsidemode the title no longer contributes to the axis dimension; the layout reserves a caption strip in the adjacent band instead.QwtPlotLayout::scaleCaptionRect()exposes the geometry of that strip. - Multi axis plots (see Parasite Axes): all layers share the bottom band. The host layout aggregates the caption demands of every layer and splits the band between the captions at the mid points of the neighboring axis columns, so captions stay below their own column and never overlap.
- The horizontal alignment of the caption text follows
setTitleAlignment();setTitlePosition()(position along the backbone) only applies toTitleInside. - Caption text wraps when it is wider than its region - prefer short titles for narrow multi axis columns.
QwtPlotRendererincludes the captions in PNG/SVG/PDF exports (renderScaleCaption()).
Core Method Summary
QwtPlot Axis Methods
| Method | Description |
|---|---|
setAxisTitle() |
Set axis title |
setAxisTitlePlacement() |
Set title placement (inside the widget or outside as caption) |
setAxisScale() |
Set axis range |
setAxisAutoScale() |
Enable auto scaling |
setAxisVisible() |
Set axis visibility |
axisWidget() |
Get axis widget |
setAxisMaxMajor() |
Set maximum number of major ticks |
setAxisMaxMinor() |
Set maximum number of minor ticks |
QwtScaleWidget Methods
| Method | Description |
|---|---|
setTitle() |
Set axis title |
setTitlePlacement() |
Set title placement (TitleInside/TitleOutside) |
setFont() |
Set label font |
setBuiltInAction() |
Enable built-in interaction |
setColorBarEnabled() |
Enable color bar |
setColorMap() |
Set color map |
setTickPosition() |
Set tick position |
setScaleDraw() |
Set scale draw object |
Axis Configuration Recommendations
- For numeric axes, automatic scaling meets most needs
- For time axes, use
QwtDateScaleEngine - For logarithmic axes, use
QwtLogScaleEngine
Related Examples
- Axis interaction: Multiple examples in
examples/2D - Outside axis titles:
examples/2D/outsideTitle - Color bar:
examples/2D/spectrogram - Tick demo:
playground/scaleengine