Spectrogram / Heatmap - QwtPlotSpectrogram
QwtPlotSpectrogram is used to draw spectrograms or heatmaps, displaying three-dimensional data on a 2D plane where the third dimension (intensity value) is represented by color. Widely used in scientific data analysis, image processing, acoustic analysis, and other fields.
Key Features
Features
- Image display mode: Maps numeric values to colors to display 2D data fields
- Contour display mode: Draws contour lines at specified values
- Multiple color maps: Supports linear, gradient, discrete, and other color mapping methods
- Multi-threaded rendering: Supports multi-core parallel rendering for improved large data processing efficiency
- Data interpolation: Supports multiple interpolation algorithms for smooth display
Basic Concepts
Spectrogram Principle
A spectrogram maps three-dimensional data (x, y, value) onto a 2D plane:
| Y-axis
│
│ ┌─────────────────┐
│ │ Color-coded │
│ │ intensity values│
│ │ █░▒▓█░▒▓█░▒▓█ │ ← Each pixel color corresponds to a value
│ │ ▒▓█░▒▓█░▒▓█░▒ │
│ │ ▓█░▒▓█░▒▓█░▒▓ │
│ └─────────────────┘
└──────────────────────→ X-axis
|
Display Modes
| Mode |
Enum Value |
Description |
| Image mode |
ImageMode |
Maps values to colors for display |
| Contour mode |
ContourMode |
Draws contour lines |
Class Inheritance Structure
classDiagram
class QwtPlotRasterItem {
+setData()
+setColorMap()
+setRenderThreadCount()
}
class QwtPlotSpectrogram {
+setDisplayMode()
+setColorMap()
+setContourLevels()
+setData()
}
class QwtRasterData {
+value(x, y)
+interval()
+contourLines()
}
class QwtColorMap {
+rgb()
+color()
+colorTable()
}
QwtPlotRasterItem <|-- QwtPlotSpectrogram
QwtPlotSpectrogram --> QwtRasterData : uses
QwtPlotSpectrogram --> QwtColorMap : uses
Usage
The spectrogram example is located at: examples/2D/spectrogram. Screenshot below:
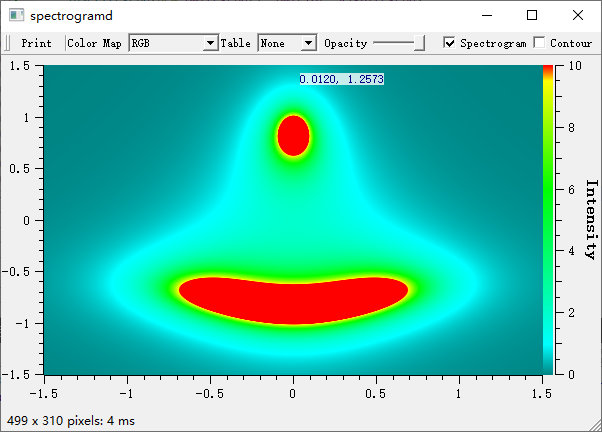
1. Basic Spectrogram
 1
 2
 3
 4
 5
 6
 7
 8
 9
10
11
12
13
14
15
16
17
18
19
20
21
22
23
24
25
26
27
28
29 | #include <QwtPlot>
#include <QwtPlotSpectrogram>
#include <QwtRasterData>
#include <QwtColorMap>
QwtPlot* plot = new QwtPlot();
plot->setTitle("Spectrogram Example");
plot->setCanvasBackground(Qt::black);
// Create spectrogram
QwtPlotSpectrogram* spectrogram = new QwtPlotSpectrogram();
// Enable image display mode
spectrogram->setDisplayMode(QwtPlotSpectrogram::ImageMode, true);
// Set color map
QwtLinearColorMap* colorMap = new QwtLinearColorMap(Qt::darkBlue, Qt::yellow);
colorMap->addColorStop(0.2, Qt::blue);
colorMap->addColorStop(0.4, Qt::cyan);
colorMap->addColorStop(0.6, Qt::green);
colorMap->addColorStop(0.8, Qt::orange);
spectrogram->setColorMap(colorMap);
// Create data
// Using a custom QwtRasterData derived class here
spectrogram->setData(new MyRasterData());
spectrogram->attach(plot);
plot->replot();
|
2. Custom Raster Data
Create a QwtRasterData derived class to provide data:
 1
 2
 3
 4
 5
 6
 7
 8
 9
10
11
12
13
14
15
16
17
18
19
20
21
22
23
24
25
26
27
28
29
30
31
32
33
34 | #include <QwtRasterData>
#include <QwtInterval>
// Custom raster data class
class MyRasterData : public QwtRasterData
{
public:
MyRasterData()
{
// Set data range
setInterval(Qt::XAxis, QwtInterval(0, 100));
setInterval(Qt::YAxis, QwtInterval(0, 100));
setInterval(Qt::ZAxis, QwtInterval(0, 1)); // Value range
}
// Return value at specified position (core method)
virtual double value(double x, double y) const override
{
// Example: compute value at position
double dx = x - 50;
double dy = y - 50;
double dist = std::sqrt(dx * dx + dy * dy);
return std::exp(-dist / 20.0); // Gaussian distribution
}
// Optional: return contour line data
virtual QList<QwtContourLine> contourLines(
const QList<double>& levels,
const QRectF& rect) const override
{
// Implement contour line computation
return QwtRasterData::contourLines(levels, rect);
}
};
|
3. Color Map Configuration
Linear Color Map
 1
 2
 3
 4
 5
 6
 7
 8
 9
10
11
12
13
14 | // Create a linear color map from blue to red
QwtLinearColorMap* colorMap = new QwtLinearColorMap(Qt::blue, Qt::red);
// Set format (RGB or Indexed)
colorMap->setFormat(QwtColorMap::RGB); // RGB mode, smooth color transitions
// Add color stops
colorMap->addColorStop(0.0, Qt::black); // Minimum: black
colorMap->addColorStop(0.3, Qt::blue); // 30%: blue
colorMap->addColorStop(0.5, Qt::green); // 50%: green
colorMap->addColorStop(0.7, Qt::yellow); // 70%: yellow
colorMap->addColorStop(1.0, Qt::white); // Maximum: white
spectrogram->setColorMap(colorMap);
|
Predefined Color Maps
| // Use Qwt's built-in Hue color map (rainbow)
QwtHueColorMap* hueMap = new QwtHueColorMap();
hueMap->setHueRange(0.0, 360.0); // Full hue range
spectrogram->setColorMap(hueMap);
// Use Alpha color map (transparency variation)
QwtAlphaColorMap* alphaMap = new QwtAlphaColorMap();
alphaMap->setAlphaRange(0, 255);
spectrogram->setColorMap(alphaMap);
|
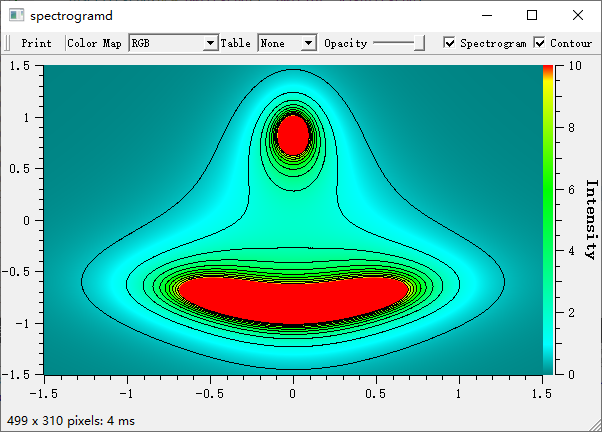
4. Contour Display
1
2
3
4
5
6
7
8
9
10
11
12
13
14 | // Enable contour mode
spectrogram->setDisplayMode(QwtPlotSpectrogram::ContourMode, true);
// Set contour levels
QList<double> contourLevels;
contourLevels << 0.1 << 0.2 << 0.3 << 0.4 << 0.5 << 0.6 << 0.7 << 0.8;
spectrogram->setContourLevels(contourLevels);
// Set contour line style
spectrogram->setDefaultContourPen(QPen(Qt::white, 1));
// Display both image and contour lines
spectrogram->setDisplayMode(QwtPlotSpectrogram::ImageMode, true);
spectrogram->setDisplayMode(QwtPlotSpectrogram::ContourMode, true);
|
5. Data Resolution Settings
| // Set pixel resolution (size of data unit per pixel)
spectrogram->setPixelSize(2.0); // 2 data units per pixel
// Or use recommended resolution for automatic calculation
spectrogram->setRenderHint(QwtPlotRasterItem::RenderAntialiased);
|
6. Multi-Threaded Rendering
| // Set rendering thread count (improves large data rendering performance)
spectrogram->setRenderThreadCount(4); // Use 4 threads for parallel rendering
// Default value is 0 (single-threaded)
|
Multi-Threaded Rendering Recommendations
- When data exceeds 1 million pixels, multi-threading is recommended
- Set thread count to the number of CPU cores, not exceeding 8
- Multi-threaded rendering is most effective in image mode
7. Using Matrix Data
 1
 2
 3
 4
 5
 6
 7
 8
 9
10
11
12
13
14
15
16
17
18
19
20
21 | #include <QwtMatrixRasterData>
// Use matrix data class
QwtMatrixRasterData* matrixData = new QwtMatrixRasterData();
// Set data matrix
QVector<double> values;
for (int i = 0; i < 100 * 100; i++) {
values << (rand() % 100);
}
matrixData->setValueMatrix(values, 100); // 100x100 matrix
// Set data range
matrixData->setInterval(Qt::XAxis, QwtInterval(0, 100));
matrixData->setInterval(Qt::YAxis, QwtInterval(0, 100));
matrixData->setInterval(Qt::ZAxis, QwtInterval(0, 100));
// Set interpolation method
matrixData->setResampleMode(QwtMatrixRasterData::BilinearInterpolation);
spectrogram->setData(matrixData);
|
8. Color Bar
Add a color bar to show the correspondence between colors and values:
1
2
3
4
5
6
7
8
9
10
11
12 | #include <QwtScaleWidget>
// Add color bar on the right side
QwtScaleWidget* rightAxis = plot->axisWidget(QwtAxis::YRight);
rightAxis->setColorBarEnabled(true);
rightAxis->setColorBarWidth(20);
// Set color bar range and color map
rightAxis->setColorMap(QwtInterval(0, 100), colorMap);
// Show right axis
plot->setAxisVisible(QwtAxis::YRight, true);
|
Core Methods Summary
| Method |
Description |
setData() |
Set raster data |
setColorMap() |
Set color map |
setDisplayMode() |
Set display mode |
setContourLevels() |
Set contour levels |
setDefaultContourPen() |
Set contour line pen |
setPixelSize() |
Set pixel resolution |
setRenderThreadCount() |
Set rendering thread count |
data() |
Get raster data |
colorMap() |
Get color map |
Color Map Classes Summary
| Class |
Description |
QwtLinearColorMap |
Linear color map with smooth color transitions |
QwtHueColorMap |
Hue-based color map with rainbow effect |
QwtAlphaColorMap |
Alpha color map with transparency variation |
QwtLogColorMap |
Logarithmic color map, suitable for wide-range data |
Application Scenarios
- Scientific data analysis: Temperature fields, pressure fields, etc.
- Image processing: Heatmaps, density maps
- Acoustic analysis: Spectrograms, sonar images
- Geographic data: Topographic maps, ocean depth maps
Related Examples
- Spectrogram demo:
examples/2D/spectrogram