Stock K-Line Chart (Candlestick Chart) - QwtPlotTradingCurve
QwtPlotTradingCurve is a specialized plot item class for drawing stock/financial K-line charts (candlestick charts). It supports displaying trading data such as open, close, high, and low prices, and is commonly used for financial data visualization and technical analysis.
Key Features
Features
- Standard K-line styles: Supports candlestick, American bar, and other styles
- Up/down color differentiation: Automatically displays up/down colors based on open/close prices
- Auto-scaling range: Automatically calculates appropriate display range based on data
- Symbol style customization: Customizable up/down bar styles
Basic Concepts
K-Line Composition
Each K-line contains four price data points:
| High
│
┌──────┴──────┐
│ │
│ ┌────┐ │ ← Body (open to close)
│ │ │ │
│ └────┘ │
│ │
└─────────────┘
│
Low
|
K-Line Styles
| Style |
Enum Value |
Description |
| Candlestick |
CandleStick |
Displays complete body with upper and lower shadows |
| American bar |
Bar |
Shows lines only, no body drawn |
Data Structure
Uses QwtTradingSample to represent each K-line's data:
| struct QwtTradingSample {
double time; // Time point (X-axis position)
double open; // Open price
double close; // Close price
double high; // High price
double low; // Low price
};
|
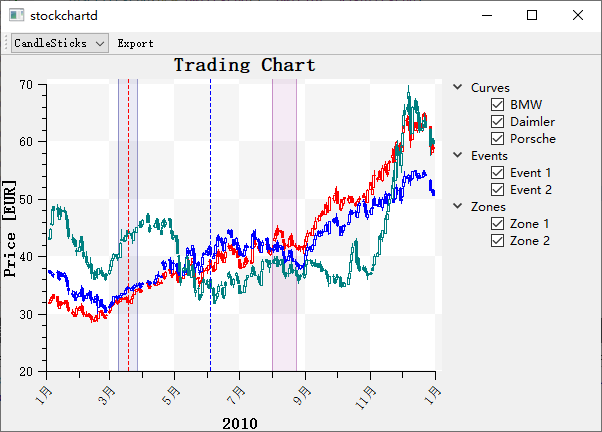
Usage
The stock K-line chart example is located at: examples/2D/stockchart. Screenshot below:
1. Basic K-Line Chart
 1
 2
 3
 4
 5
 6
 7
 8
 9
10
11
12
13
14
15
16
17
18
19
20
21
22
23
24
25
26
27
28
29
30
31
32
33
34
35 | #include <QwtPlot>
#include <QwtPlotTradingCurve>
QwtPlot* plot = new QwtPlot();
plot->setTitle("Stock K-Line Chart");
plot->setCanvasBackground(Qt::white);
// Create K-line chart
QwtPlotTradingCurve* curve = new QwtPlotTradingCurve("Daily K-Line");
// Set style
curve->setStyle(QwtPlotTradingCurve::CandleStick);
// Set up/down colors
curve->setSymbolBrush(QwtPlotTradingCurve::Positive,
QBrush(Qt::red)); // Up (close > open): red
curve->setSymbolBrush(QwtPlotTradingCurve::Negative,
QBrush(Qt::green)); // Down (close < open): green
// Set body width
curve->setSymbolExtent(0.8); // 80% of relative width
// Prepare data
QVector<QwtTradingSample> samples;
samples << QwtTradingSample(1, 10.0, 10.5, 11.0, 9.5); // Up
samples << QwtTradingSample(2, 10.5, 10.2, 10.8, 10.0); // Down
samples << QwtTradingSample(3, 10.2, 10.8, 11.2, 10.1); // Up
samples << QwtTradingSample(4, 10.8, 10.6, 11.0, 10.4); // Down
curve->setSamples(samples);
curve->attach(plot);
// Set axes
plot->setAxisScale(QwtAxis::YLeft, 9, 12);
plot->replot();
|
2. K-Line Style Configuration
Candlestick Style
1
2
3
4
5
6
7
8
9
10
11
12 | curve->setStyle(QwtPlotTradingCurve::CandleStick);
// Set up/down styles
curve->setSymbolBrush(QwtPlotTradingCurve::Positive, QBrush(Qt::red));
curve->setSymbolPen(QwtPlotTradingCurve::Positive, QPen(Qt::darkRed, 1));
curve->setSymbolBrush(QwtPlotTradingCurve::Negative, QBrush(Qt::green));
curve->setSymbolPen(QwtPlotTradingCurve::Negative, QPen(Qt::darkGreen, 1));
// Neutral style (open == close)
curve->setSymbolBrush(QwtPlotTradingCurve::Neutral, QBrush(Qt::gray));
curve->setSymbolPen(QwtPlotTradingCurve::Neutral, QPen(Qt::black, 1));
|
American Bar Style
| curve->setStyle(QwtPlotTradingCurve::Bar);
// American bar shows lines only, no body drawn
// Line extends from low to high, with small horizontal marks indicating open and close prices
|
3. Body Width Settings
| // Set body width (in relative coordinate units)
curve->setSymbolExtent(0.5); // Body width is 0.5 coordinate units
// Minimum width (in pixels)
curve->setMinSymbolWidth(3); // Minimum 3 pixels wide
// Maximum width (in pixels)
curve->setMaxSymbolWidth(20); // Maximum 20 pixels wide
|
4. Data Settings
| // Using QwtTradingSample array
QVector<QwtTradingSample> samples;
for (int i = 0; i < count; i++) {
samples << QwtTradingSample(
time[i], open[i], close[i], high[i], low[i]
);
}
curve->setSamples(samples);
// Using QwtSeriesData
curve->setSamples(seriesData);
|
5. Combining with Volume Chart
| // Create volume bar chart
QwtPlotBarChart* volumeChart = new QwtPlotBarChart("Volume");
QVector<double> volumes;
volumes << 1000 << 1500 << 800 << 2000;
volumeChart->setSamples(volumes);
volumeChart->setBrush(QBrush(Qt::gray));
volumeChart->attach(plot);
|
6. Adding Moving Averages
 1
 2
 3
 4
 5
 6
 7
 8
 9
10
11
12
13 | #include <QwtPlotCurve>
// Add 5-day moving average
QwtPlotCurve* ma5 = new QwtPlotCurve("MA5");
ma5->setPen(QPen(Qt::blue, 1));
ma5->setSamples(ma5Data);
ma5->attach(plot);
// Add 10-day moving average
QwtPlotCurve* ma10 = new QwtPlotCurve("MA10");
ma10->setPen(QPen(Qt::yellow, 1));
ma10->setSamples(ma10Data);
ma10->attach(plot);
|
Core Methods Summary
| Method |
Description |
setSamples() |
Set K-line data |
setStyle() |
Set K-line style |
setSymbolBrush() |
Set up/down fill color |
setSymbolPen() |
Set up/down border color |
setSymbolExtent() |
Set body width |
setMinSymbolWidth() |
Set minimum width (pixels) |
setMaxSymbolWidth() |
Set maximum width (pixels) |
Up/Down State Determination
| State |
Enum Value |
Condition |
| Up |
Positive |
close > open |
| Down |
Negative |
close < open |
| Neutral |
Neutral |
close == open |
Color Conventions
- Chinese market: Red for up, green for down
- International market: Green for up, red for down
- Colors can be adjusted as needed
Related Examples
- Stock chart demo:
examples/2D/stockchart