Scatter Plot - QwtPlotCurve Scatter Mode
Scatter plots are used to display data distribution, with each data point marked by an independent symbol. In Qwt, scatter plots are implemented using QwtPlotCurve combined with QwtSymbol.
Key Features
Features
- Multiple symbol shapes: Supports ellipse, rectangle, diamond, triangle, cross, and other shapes
- Symbol style customization: Configurable size, fill color, border color, and border width
- High-performance scatter mode: Use
Dots style to efficiently render millions of data points
- Symbol jitter: Prevents visual occlusion of overlapping points
Basic Concepts
Scatter Plot Implementation Methods
Qwt provides three ways to draw scatter plots:
| Method |
Curve Style |
Description |
| NoCurve + Symbol |
NoCurve |
Show symbols only, no connecting lines |
| Dots |
Dots |
Draw pixel points only, highest performance |
| Lines + Symbol |
Lines |
Display both connecting lines and symbols |
| Data Size |
NoCurve+Symbol |
Dots |
| <1000 points |
Fast |
Fastest |
| 1000-10000 points |
Fairly fast |
Fast |
| >10000 points |
Slow |
Fast |
| >100000 points |
Very slow |
Fastest (recommended) |
Usage
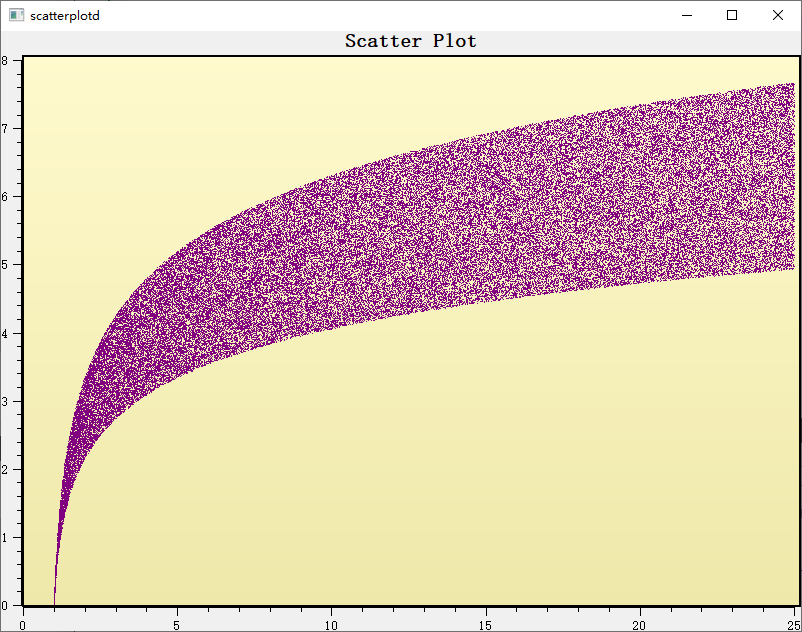
The scatter plot example is located at: examples/2D/scatterplot. Screenshot below:
1. Basic Scatter Plot
Use NoCurve style with symbols to draw a scatter plot:
 1
 2
 3
 4
 5
 6
 7
 8
 9
10
11
12
13
14
15
16
17
18
19
20
21
22
23
24
25
26
27
28
29
30
31
32
33
34 | #include <QwtPlot>
#include <QwtPlotCurve>
#include <QwtSymbol>
QwtPlot* plot = new QwtPlot();
plot->setTitle("Scatter Plot Example");
plot->setCanvasBackground(Qt::white);
// Create scatter curve
QwtPlotCurve* scatter = new QwtPlotCurve("Data Points");
// Set to no-line mode
scatter->setStyle(QwtPlotCurve::NoCurve);
// Create symbol
QwtSymbol* symbol = new QwtSymbol(
QwtSymbol::Ellipse, // Ellipse shape
QBrush(Qt::blue), // Blue fill
QPen(Qt::darkBlue, 1), // Dark blue border
QSize(8, 8) // Size
);
scatter->setSymbol(symbol);
// Set data
QPolygonF points;
for (int i = 0; i < 100; i++) {
double x = rand() % 100;
double y = rand() % 100;
points << QPointF(x, y);
}
scatter->setSamples(points);
scatter->attach(plot);
plot->replot();
|
For large numbers of data points, use Dots style for optimal performance:
 1
 2
 3
 4
 5
 6
 7
 8
 9
10
11
12
13
14
15
16
17
18
19
20 | QwtPlotCurve* scatter = new QwtPlotCurve("Large-Scale Scatter");
// Use Dots style - draws pixel points only, highest performance
scatter->setStyle(QwtPlotCurve::Dots);
// Optional: Enable image buffer optimization
scatter->setPaintAttribute(QwtPlotCurve::ImageBuffer, true);
// Set color (Dots style does not require Symbol)
scatter->setPen(Qt::blue); // Point color
// Generate 1 million points
QVector<double> xData(1000000), yData(1000000);
for (int i = 0; i < 1000000; i++) {
xData[i] = rand() % 1000;
yData[i] = rand() % 1000;
}
scatter->setSamples(xData, yData);
scatter->attach(plot);
|
Dots vs Symbol Performance
Dots style draws pixel points directly, suitable for millions of data pointsNoCurve + Symbol treats each point as a full symbol drawing object, suitable for small datasets- For real-time scatter plots,
Dots is recommended
3. Multiple Symbol Styles
 1
 2
 3
 4
 5
 6
 7
 8
 9
10
11
12
13
14
15
16
17
18
19
20
21
22
23
24
25
26
27
28
29
30
31 | // Circle symbol
QwtSymbol* circle = new QwtSymbol(QwtSymbol::Ellipse,
QBrush(Qt::red), QPen(Qt::darkRed, 2), QSize(10, 10));
// Rectangle symbol
QwtSymbol* rect = new QwtSymbol(QwtSymbol::Rect,
QBrush(Qt::green), QPen(Qt::darkGreen, 1), QSize(8, 8));
// Diamond symbol
QwtSymbol* diamond = new QwtSymbol(QwtSymbol::Diamond,
QBrush(Qt::blue), QPen(Qt::darkBlue, 1), QSize(12, 12));
// Cross symbol (no fill)
QwtSymbol* cross = new QwtSymbol(QwtSymbol::Cross,
Qt::NoBrush, QPen(Qt::black, 2), QSize(8, 8));
// X-cross symbol
QwtSymbol* xcross = new QwtSymbol(QwtSymbol::XCross,
Qt::NoBrush, QPen(Qt::magenta, 2), QSize(10, 10));
// Triangle symbol
QwtSymbol* triangle = new QwtSymbol(QwtSymbol::Triangle,
QBrush(Qt::yellow), QPen(Qt::orange, 1), QSize(10, 10));
// Star symbol
QwtSymbol* star = new QwtSymbol(QwtSymbol::Star1,
QBrush(Qt::cyan), QPen(Qt::darkCyan, 1), QSize(12, 12));
// Hexagon symbol
QwtSymbol* hexagon = new QwtSymbol(QwtSymbol::Hexagon,
QBrush(Qt::lightGray), QPen(Qt::gray, 1), QSize(10, 10));
|
4. Symbol Jitter
When multiple data points are close together, jitter can be used to avoid overlap:
| // Set symbol jitter range
// Parameter is the jitter width relative to the coordinate range
scatter->setSymbolJitter(0.05); // 5% jitter range
// Note: setSymbolJitter is a method of QwtPlotCurve
|
Jitter Principle
Jitter adds a random offset to each point's X coordinate during rendering, dispersing overlapping points to make the data density distribution easier to observe.
5. Multiple Scatter Data Groups
1
2
3
4
5
6
7
8
9
10
11
12
13
14
15
16
17
18
19
20
21 | // Create multiple groups with different styles
QwtPlotCurve* group1 = new QwtPlotCurve("Group A");
group1->setStyle(QwtPlotCurve::NoCurve);
group1->setSymbol(new QwtSymbol(QwtSymbol::Ellipse,
QBrush(Qt::red), QPen(Qt::darkRed), QSize(8, 8)));
group1->setSamples(pointsA);
group1->attach(plot);
QwtPlotCurve* group2 = new QwtPlotCurve("Group B");
group2->setStyle(QwtPlotCurve::NoCurve);
group2->setSymbol(new QwtSymbol(QwtSymbol::Rect,
QBrush(Qt::blue), QPen(Qt::darkBlue), QSize(8, 8)));
group2->setSamples(pointsB);
group2->attach(plot);
QwtPlotCurve* group3 = new QwtPlotCurve("Group C");
group3->setStyle(QwtPlotCurve::NoCurve);
group3->setSymbol(new QwtSymbol(QwtSymbol::Diamond,
QBrush(Qt::green), QPen(Qt::darkGreen), QSize(8, 8)));
group3->setSamples(pointsC);
group3->attach(plot);
|
6. Lines and Symbols Combined
1
2
3
4
5
6
7
8
9
10
11
12
13 | // Display both connecting lines and data point symbols
QwtPlotCurve* curve = new QwtPlotCurve("Curve with Symbols");
// Set line style
curve->setStyle(QwtPlotCurve::Lines);
curve->setPen(QPen(Qt::blue, 2));
// Set symbol
curve->setSymbol(new QwtSymbol(QwtSymbol::Ellipse,
QBrush(Qt::white), QPen(Qt::blue), QSize(6, 6)));
curve->setSamples(points);
curve->attach(plot);
|
Symbol Shape List
| Shape |
Enum Value |
Description |
NoSymbol |
No symbol |
No symbol displayed |
Ellipse |
Ellipse |
Circle or ellipse (depending on size) |
Rect |
Rectangle |
Square or rectangle |
Diamond |
Diamond |
Diamond shape |
Triangle |
Triangle |
Upward triangle |
DTriangle |
Down triangle |
Downward triangle |
UTriangle |
Up triangle |
Same as Triangle |
LTriangle |
Left triangle |
Left-pointing triangle |
RTriangle |
Right triangle |
Right-pointing triangle |
Cross |
Cross |
+ shaped cross |
XCross |
X-cross |
X shaped cross |
Star1 |
Star |
Six-pointed star |
Star2 |
Star 2 |
Five-pointed star |
Hexagon |
Hexagon |
Regular hexagon |
Path |
Path |
Custom QPainterPath |
Custom Symbol Path
 1
 2
 3
 4
 5
 6
 7
 8
 9
10
11
12
13
14
15
16
17
18
19
20
21 | #include <QPainterPath>
// Create custom shape
QPainterPath path;
path.moveTo(0, -10); // Top
path.lineTo(8, 5); // Right shoulder
path.lineTo(5, 5); // Right waist
path.lineTo(0, 0); // Center
path.lineTo(-5, 5); // Left waist
path.lineTo(-8, 5); // Left shoulder
path.closeSubpath();
// Create custom symbol
QwtSymbol* customSymbol = new QwtSymbol();
customSymbol->setStyle(QwtSymbol::Path);
customSymbol->setPath(path);
customSymbol->setBrush(QBrush(Qt::red));
customSymbol->setPen(QPen(Qt::darkRed, 1));
customSymbol->setSize(20, 20);
scatter->setSymbol(customSymbol);
|
Symbol Core Methods
| Method |
Description |
setStyle() |
Set symbol shape |
setSize() |
Set symbol dimensions |
setBrush() |
Set fill brush |
setPen() |
Set border pen |
setPath() |
Set custom path |
setPinPoint() |
Set symbol anchor position |
drawSymbol() |
Draw symbol |
Related Examples
- Scatter plot:
examples/2D/scatterplot
- Symbol demo:
playground/symbols
- Curve styles:
examples/2D/curvedemo