Box Chart (Box-and-Whisker Plot) User Guide
QwtPlotBoxChart is Qwt's box-and-whisker plot drawing class, used to visually display statistical distribution characteristics of data. Box plots can clearly present key statistical information such as median, quartiles, and outliers, making them an indispensable tool for data analysis and scientific visualization.
Key Features
Features
- Flexible data input: Supports both pre-computed statistics and automatic calculation from raw data
- Automatic statistical computation: Built-in statistics calculator supporting Tukey, percentile, standard deviation, and other calculation methods
- Diverse box styles: Rectangle, diamond, and notch display styles for different analysis scenarios
- Flexible orientation: Vertical and horizontal display orientations to meet different layout requirements
- Intelligent outlier handling: Automatic outlier detection with customizable symbols and jitter display
- Rich style customization: Box fill, border, median line, and whisker styles are all customizable
Basic Concepts
What is a Box Plot
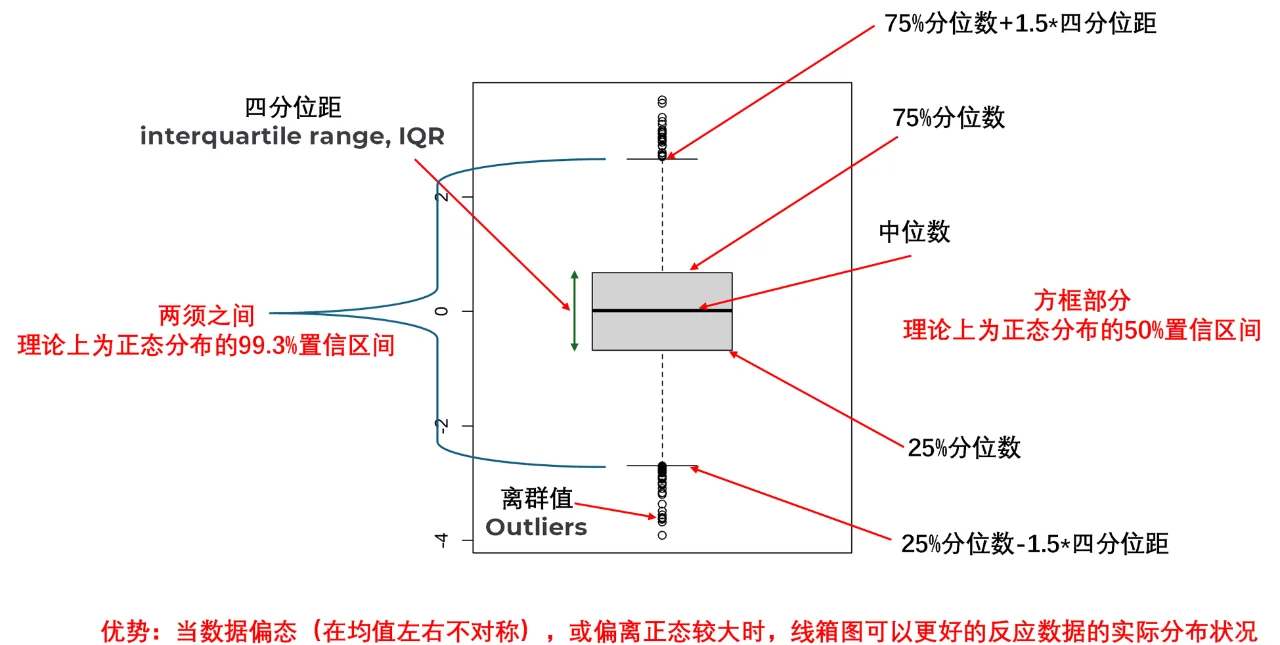
A box-and-whisker plot is a statistical chart used to display data distribution characteristics. It describes data distribution through five key values (five-number summary):
- Minimum: The smallest value in the dataset or the lower whisker position
- Q1 (First Quartile): 25% of the data falls below this value
- Median: The middle value of the data, 50th percentile
- Q3 (Third Quartile): 75% of the data falls below this value
- Maximum: The largest value in the dataset or the upper whisker position
Box Plot Structure Diagram
The figure below shows the components of a standard box plot:
Class Relationship Structure
The inheritance and composition relationships of box plot related classes are as follows:
classDiagram
    class QwtPlotSeriesItem {
        +drawSeries()
        +boundingRect()
        +rtti()
    }

    class QwtSeriesStore~T~ {
        +setData()
        +sample(i)
        +size()
    }

    class QwtPlotBoxChart {
        +setBoxStyle()
        +setWhiskerStyle()
        +setOrientation()
        +setSamples()
        +setOutliers()
        +setBrush()
        +setPen()
    }

    class QwtBoxSample {
        +position
        +whiskerLower
        +q1
        +median
        +q3
        +whiskerUpper
    }

    class QwtBoxOutlierSample {
        +boxPosition
        +values
    }

    class QwtBoxStatisticsCalculator {
        +calculate()
        +calculateFromRaw()
        +calculateFull()
        +extractOutliers()
    }

    QwtPlotSeriesItem <|-- QwtPlotBoxChart
    QwtSeriesStore <|-- QwtPlotBoxChart
    QwtPlotBoxChart --> QwtBoxSample : uses
    QwtPlotBoxChart --> QwtBoxOutlierSample : uses
    QwtBoxStatisticsCalculator --> QwtBoxSample : creates
    QwtBoxStatisticsCalculator --> QwtBoxOutlierSample : creates
Data Structures in Detail
QwtBoxSample
QwtBoxSample is the core data structure of the box plot, representing all statistical values for a single box:
1 2 3 4 5 6 7 8 9 | |
Parameter Order Note
Constructor parameter order: position, whiskerLower, q1, median, q3, whiskerUpper
Ensure parameters are passed in the correct order, otherwise the box plot will display incorrectly
QwtBoxOutlierSample
Outlier data is stored separately from box data:
1 2 3 4 | |
Advantages of separating outlier data from box data:
- Independent rendering control: Outliers can use different symbols, colors, and sizes
- Flexible data management: Outliers can be added or removed independently without affecting box data
- Avoid data redundancy: Box data and outlier data are maintained independently
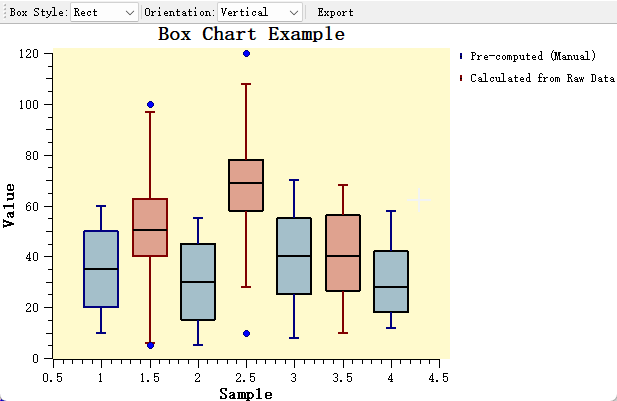
Usage
The box chart example is located at: examples/2D/boxchart. Screenshot below:
1. Creating a Basic Box Plot
The simplest approach is to directly provide pre-computed statistical data. This is suitable for scenarios where statistical analysis has already been completed.
Applicable scenarios:
- Data already processed by other statistical software
- Precise control over each statistical value is needed
- Batch display of multiple pre-computed statistical datasets
1 2 3 4 5 6 7 8 9 10 11 12 13 14 15 16 17 18 19 20 21 22 23 24 25 26 | |
2. Automatic Calculation from Raw Data
When only raw data is available, use QwtBoxStatisticsCalculator to automatically compute statistics and outliers.
Applicable scenarios:
- Real-time data analysis display
- Direct visualization of raw data
- Dynamic data update scenarios
1 2 3 4 5 6 7 8 9 10 11 12 13 14 15 16 17 18 19 20 21 22 23 24 25 26 27 28 29 30 31 32 33 34 35 36 37 38 39 40 41 42 43 44 45 46 47 48 49 | |
3. Statistical Calculation Methods in Detail
QwtBoxStatisticsCalculator provides multiple whisker calculation methods for different data analysis needs:
flowchart LR
    A[Raw Data] --> B{Select Method}
    B -->|Tukey| C[1.5*IQR]
    B -->|Percentile| D[Specified Percentile]
    B -->|MinMax| E[Min/Max Values]
    B -->|SD| F[Standard Deviation Range]
    B -->|SE| G[Standard Error Range]
    C --> H[Output: Sample + Outliers]
    D --> H
    E --> H
    F --> H
G --> H| Calculation Method | Applicable Scenario | Description |
|---|---|---|
Tukey |
Standard box plot | Uses 1.5*IQR to determine whisker range, the most classic outlier detection method |
Percentile |
Custom range | Uses specified percentiles (e.g., 5th and 95th) as whisker endpoints |
MinMax |
Full data range | Whiskers extend to the minimum and maximum values of the data, no outliers displayed |
StandardDeviation |
Normally distributed data | Uses mean +/- n*standard deviation to determine range |
StandardError |
Statistical inference | Uses mean +/- n*standard error, suitable for sample statistical inference |
Method Selection Recommendations
- General data analysis: Use Tukey method (default)
- Custom outlier criteria: Use Percentile or adjust the Tukey coefficient
- Display full data distribution: Use MinMax
- Normal distribution testing: Use StandardDeviation
4. Box Style Configuration
QwtPlotBoxChart provides three box display styles, each with different visual effects and analytical purposes:
1 2 3 4 5 6 7 8 | |
Style Selection Guide
Rect: Standard box plot style, suitable for most scenariosDiamond: Suitable for comparing distribution symmetry across multiple groupsNotch: Notch represents the median confidence interval; if notches of two groups do not overlap, their medians are significantly different
5. Display Orientation Switching
Box plots support both vertical and horizontal display orientations, adjustable based on plot layout:
1 2 3 4 5 | |
When switching orientation, note the following:
Refresh After Orientation Switch
After switching orientation, call plot->replot() or plot->setAxisAutoScale() to refresh the axes,
otherwise the axis ranges may not adapt to the new data orientation
1 2 3 4 5 6 7 8 9 10 11 12 13 14 15 16 17 18 | |
6. Outlier Style Customization
Outliers are an important component of box plots, and their display style can be independently customized:
1 2 3 4 5 6 7 8 9 10 11 12 | |
Jitter Feature Description:
When multiple outlier values are identical or similar, they will overlap at the same position when displayed