Scale Engine - QwtScaleEngine
QwtScaleEngine is the calculation engine for axis ticks, responsible for automatically calculating reasonable tick positions and labels based on the data range. Different types of scale engines support different tick strategies.
Main Features
Features
- ✅ Automatic tick calculation: Automatically calculates major and minor ticks based on data range
- ✅ Multiple scale types: Supports linear, logarithmic, date, and other scale engines
- ✅ Tick optimization: Automatically selects aesthetically pleasing tick intervals (e.g., 10, 5, 2)
- ✅ Boundary handling: Supports tick calculation with included/excluded boundaries
Basic Concepts
Scale Engine Types
| Engine Class |
Description |
QwtLinearScaleEngine |
Linear scale engine (default) |
QwtLogScaleEngine |
Logarithmic scale engine |
QwtDateScaleEngine |
Date/time scale engine |
Scale Division Structure
QwtScaleDiv represents the scale division result:
| QwtScaleDiv contains:
- Interval: Data range [min, max]
- MajorTicks: List of major tick positions
- MinorTicks: List of minor tick positions
- MediumTicks: List of medium tick positions
|
Usage
1. Linear Scale Engine (Default)
1
2
3
4
5
6
7
8
9
10
11
12 | #include <QwtPlot>
QwtPlot* plot = new QwtPlot();
// Uses linear scale engine by default
plot->setAxisAutoScale(QwtAxis::XBottom);
// Set maximum number of major ticks
plot->setAxisMaxMajor(QwtAxis::XBottom, 10); // Up to 10 major ticks
// Set maximum number of minor ticks
plot->setAxisMaxMinor(QwtAxis::XBottom, 5); // Up to 5 minor ticks per major tick interval
|
2. Logarithmic Scale Engine
Used for large-range data or exponential relationship data:
| #include <QwtLogScaleEngine>
// Set logarithmic scale engine
plot->setAxisScaleEngine(QwtAxis::YLeft, new QwtLogScaleEngine());
// Set logarithmic scale range
plot->setAxisScale(QwtAxis::YLeft, 0.001, 1000); // Spans 6 orders of magnitude
// Logarithmic scale characteristics:
// - Major ticks at 10^n positions (1, 10, 100, 1000...)
// - Minor ticks at intermediate positions (2, 3, 4, 5, 6, 7, 8, 9)
|
3. Date Scale Engine
Used for time series data:
 1
 2
 3
 4
 5
 6
 7
 8
 9
10
11
12
13
14
15
16
17
18 | #include <QwtDateScaleEngine>
#include <QwtDateScaleDraw>
// Set date scale engine
plot->setAxisScaleEngine(QwtAxis::XBottom, new QwtDateScaleEngine());
// Set date scale drawing
QwtDateScaleDraw* dateDraw = new QwtDateScaleDraw();
dateDraw->setDateFormat(QwtDateScaleDraw::Month, QString("yyyy-MM")); // Month format
dateDraw->setDateFormat(QwtDateScaleDraw::Day, QString("MM-dd")); // Day format
plot->setAxisScaleDraw(QwtAxis::XBottom, dateDraw);
// Set time range
QDateTime start = QDateTime::fromString("2024-01-01", "yyyy-MM-dd");
QDateTime end = QDateTime::fromString("2024-12-31", "yyyy-MM-dd");
plot->setAxisScale(QwtAxis::XBottom,
QwtDate::toDouble(start),
QwtDate::toDouble(end));
|
4. Custom Scale Division
 1
 2
 3
 4
 5
 6
 7
 8
 9
10
11
12
13
14
15
16
17
18
19
20
21 | #include <QwtScaleDiv>
// Manually create scale division
QwtScaleDiv scaleDiv;
scaleDiv.setInterval(0, 100); // Set range
// Set major ticks
QList<double> majorTicks;
majorTicks << 0 << 20 << 40 << 60 << 80 << 100;
scaleDiv.setTicks(QwtScaleDiv::MajorTick, majorTicks);
// Set minor ticks
QList<double> minorTicks;
for (int i = 0; i <= 100; i += 4) {
if (!majorTicks.contains(i))
minorTicks << i;
}
scaleDiv.setTicks(QwtScaleDiv::MinorTick, minorTicks);
// Apply scale division
plot->setAxisScaleDiv(QwtAxis::XBottom, scaleDiv);
|
5. Scale Engine Properties
| // Get scale engine
QwtScaleEngine* engine = plot->axisScaleEngine(QwtAxis::XBottom);
// Set engine properties
engine->setAttribute(QwtScaleEngine::IncludeReference, true); // Include reference value
engine->setAttribute(QwtScaleEngine::Symmetric, false); // Asymmetric range
engine->setAttribute(QwtScaleEngine::Floating, false); // Non-floating endpoints
// Set margins
engine->setMargins(0.05); // 5% margin
|
6. Calculating Scale Division
 1
 2
 3
 4
 5
 6
 7
 8
 9
10
11
12 | #include <QwtScaleEngine>
// Manually use engine to calculate ticks
QwtLinearScaleEngine engine;
QwtScaleDiv scaleDiv = engine.divideScale(
0, 100, // Data range
10, 5, // Max major ticks, max minor ticks
0, 100 // Reference range (optional)
);
// Apply result
plot->setAxisScaleDiv(QwtAxis::XBottom, scaleDiv);
|
Scale Engine Property Description
| Property |
Description |
IncludeReference |
Force inclusion of reference value as a tick |
Symmetric |
Force symmetric range |
Floating |
Endpoints not forced to fall on ticks |
Inverted |
Invert tick direction |
QwtDateScaleDraw supports different time-level formats:
| Level |
Enum Value |
Description |
Millisecond |
Millisecond level |
"hh ss.zzz" ss.zzz" |
Second |
Second level |
"hhss" |
Minute |
Minute level |
"hh:mm" |
Hour |
Hour level |
"hh:mm" |
Day |
Day level |
"MM-dd" |
Week |
Week level |
"MM-dd" |
Month |
Month level |
"yyyy-MM" |
Year |
Year level |
"yyyy" |
Core Method Summary
| Method |
Description |
setAxisScaleEngine() |
Set scale engine |
setAxisAutoScale() |
Enable auto scaling |
setAxisMaxMajor() |
Set maximum major ticks |
setAxisMaxMinor() |
Set maximum minor ticks |
axisScaleEngine() |
Get scale engine |
axisScaleDiv() |
Get scale division |
Scale Optimization Recommendations
- Use linear engine for linear data (default)
- Use logarithmic engine for large-range data (spanning multiple orders of magnitude)
- Use date engine for time series data
- Manually set scale division for special requirements
Related Examples
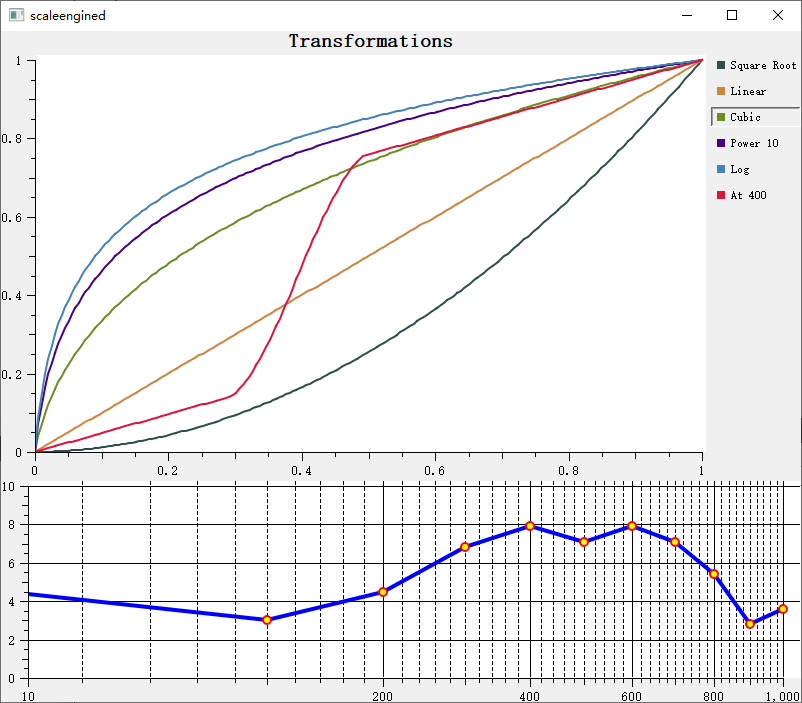
- Scale engine demo:
playground/scaleengine
Screenshot of the scale engine demo: