Data Series - QwtSeriesData
QwtSeriesData is the abstract interface for plot item data, providing data access methods for plots. By creating custom QwtSeriesData derived classes, flexible data management can be achieved, supporting data retrieval from various sources such as memory, files, and databases.
Main Features
Features
- ✅ Data abstraction interface: Defines a unified data access interface
- ✅ Multiple built-in implementations: Provides common implementations such as memory storage and external array references
- ✅ Dynamic data support: Supports real-time updates and large data scenarios
- ✅ Bounding calculation: Automatically calculates data bounding rectangle
Basic Concepts
Data Interface Structure
classDiagram
    class QwtSeriesData~T~ {
        +size() int
        +sample(i) T
        +boundingRect() QRectF
        +setRectOfInterest(rect)
    }

    class QwtPointSeriesData {
        +setSamples()
        +samples()
    }

    class QwtArraySeriesData~T~ {
        +setSamples()
        +samples()
    }

    class QwtSyntheticSeriesData {
        +value(x) double
    }

    QwtSeriesData <|-- QwtPointSeriesData
    QwtSeriesData <|-- QwtArraySeriesData
    QwtSeriesData <|-- QwtSyntheticSeriesData
Built-in Data Classes
| Class Name | Description |
|---|---|
QwtPointSeriesData |
Stores QPointF data points |
QwtArraySeriesData<T> |
Stores arbitrary type data arrays |
QwtSyntheticSeriesData |
Generates function data (not stored) |
Usage
1. Using Built-in Data Classes
1 2 3 4 5 6 7 8 9 10 11 12 13 14 15 | |
2. Referencing External Data
1 2 3 4 5 6 7 8 9 10 | |
setRawSamples Notes
- External arrays must remain valid until the curve is destroyed
- Do not modify array size, only modify contents
- Call replot to refresh display after data updates
3. Custom Data Class
Implementing a custom data source:
1 2 3 4 5 6 7 8 9 10 11 12 13 14 15 16 17 18 19 20 21 22 23 24 25 26 27 28 29 30 31 32 33 34 35 36 37 38 39 40 41 42 43 44 45 46 47 48 | |
4. Function-Generated Data
Using QwtSyntheticSeriesData to generate function curves:
1 2 3 4 5 6 7 8 9 10 11 12 13 14 15 16 17 18 19 20 21 22 23 24 25 26 27 28 | |
5. Real-time Data Updates
1 2 3 4 5 6 7 8 9 10 11 12 13 14 15 16 17 18 19 20 21 22 23 24 25 26 27 28 29 30 31 32 33 34 35 36 37 38 39 40 41 | |
Core Method Summary
QwtSeriesData Interface
| Method | Description |
|---|---|
size() |
Return number of data points |
sample(i) |
Return the i-th data point |
boundingRect() |
Return data bounding rectangle |
setRectOfInterest() |
Set region of interest (optimize rendering) |
QwtPlotCurve Data Methods
| Method | Description |
|---|---|
setData() |
Set data object |
setSamples() |
Set data arrays |
setRawSamples() |
Reference external arrays |
data() |
Get data object |
Data Management Recommendations
- Static data: Use
setSamples()to copy data - Large data: Use
setRawSamples()to avoid copying - Dynamic data: Implement custom
QwtSeriesData - Function data: Use
QwtSyntheticSeriesData
Related Examples
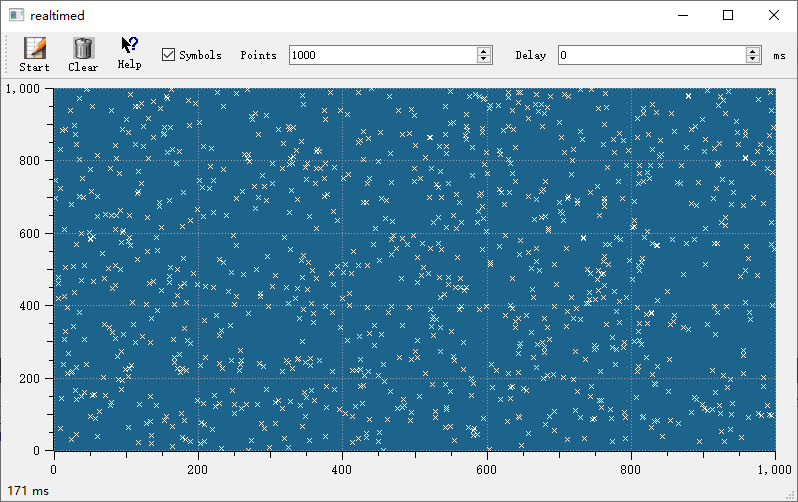
- Real-time data:
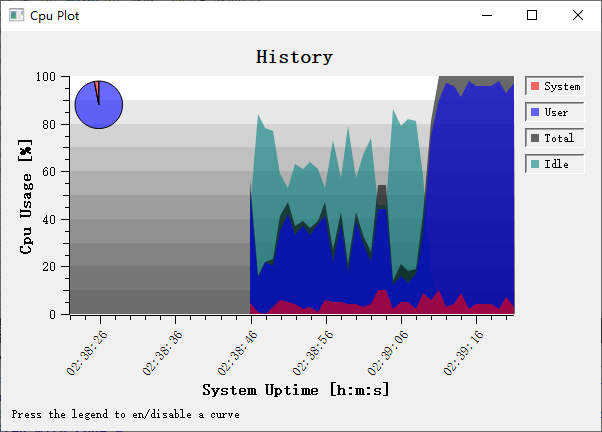
examples/2D/realtime - CPU monitor:
examples/2D/cpuplot
Screenshots of real-time data and CPU monitor: