极坐标绘图 - QwtPolarPlot
QwtPolarPlot 是用于绘制极坐标图形的控件,与传统笛卡尔坐标系的 QwtPlot 不同,它使用角度和半径两个坐标轴,适合显示雷达图、方向分布、天文数据等圆形数据。
主要功能特性
特性
- ✅ 极坐标系统:使用角度(0-360°)和半径作为坐标轴
- ✅ 曲线绘制:支持在极坐标系中绘制曲线
- ✅ 网格系统:提供同心圆和角度射线网格
- ✅ 交互支持:支持极坐标系下的缩放和平移
基本概念
极坐标结构
 1
 2
 3
 4
 5
 6
 7
 8
 9
10
11
12
13
14
15
16
17 | 90°
│
135° │ 45°
\ │ /
\ │ /
\ │ /
180°───●─+─●───0°
/ │ \
/ │ \
/ │ \
225° │ 315°
│
270°
● = 数据点
同心圆 = 半径刻度
射线 = 角度刻度
|
极坐标项类型
| 类名 |
说明 |
QwtPolarPlot |
极坐标绘图主控件 |
QwtPolarCurve |
极坐标曲线 |
QwtPolarGrid |
极坐标网格 |
QwtPolarMarker |
极坐标标记 |
使用方法
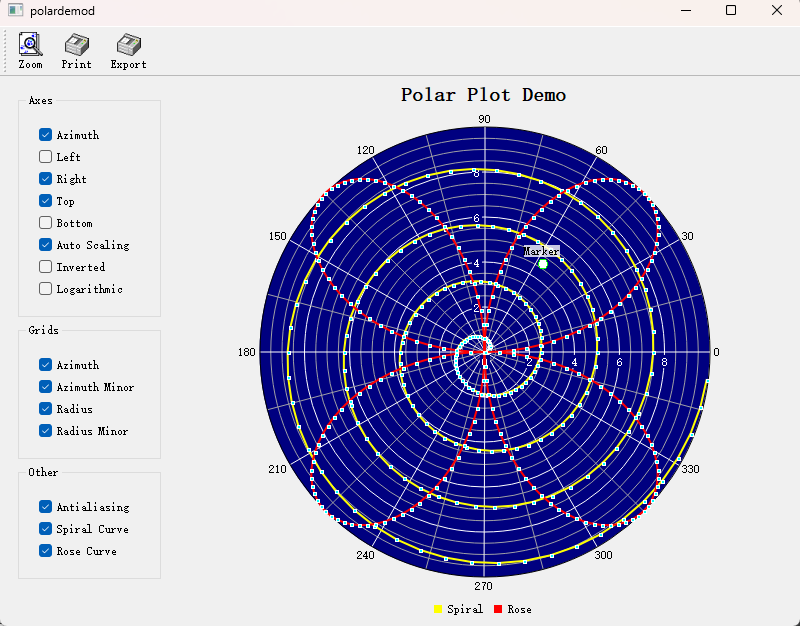
极坐标绘图的例子位于:examples/2D/polardemo,例子截图如下:
1. 创建极坐标绘图
 1
 2
 3
 4
 5
 6
 7
 8
 9
10
11
12
13
14
15
16
17
18
19
20
21
22
23
24
25
26
27
28
29
30
31
32
33 | #include <QwtPolarPlot>
#include <QwtPolarGrid>
#include <QwtPolarCurve>
// 创建极坐标绘图
QwtPolarPlot* polarPlot = new QwtPolarPlot();
polarPlot->setTitle("极坐标图示例");
// 设置角度范围(默认0-360度)
polarPlot->setScale(QwtPolar::Azimuth, 0.0, 360.0);
// 设置半径范围
polarPlot->setScale(QwtPolar::Radius, 0.0, 100.0);
// 创建极坐标网格
QwtPolarGrid* grid = new QwtPolarGrid();
grid->setPen(QPen(Qt::gray, 0.5));
grid->attach(polarPlot);
// 创建极坐标曲线
QwtPolarCurve* curve = new QwtPolarCurve("曲线数据");
// 准备数据(角度,半径)
QVector<QwtPointPolar> samples;
for (int angle = 0; angle < 360; angle += 10) {
double radius = 50 + 30 * std::sin(angle * 3.0 * M_PI / 180.0);
samples << QwtPointPolar(angle, radius);
}
curve->setSamples(samples);
curve->setPen(QPen(Qt::blue, 2));
curve->attach(polarPlot);
polarPlot->replot();
|
2. 极坐标网格配置
 1
 2
 3
 4
 5
 6
 7
 8
 9
10
11
12
13
14
15
16
17 | QwtPolarGrid* grid = new QwtPolarGrid();
// 显示角度网格线(射线)
grid->showGrid(QwtPolarGrid::Azimuth, true);
// 显示半径网格线(同心圆)
grid->showGrid(QwtPolarGrid::Radius, true);
// 设置网格样式
grid->setPen(QPen(Qt::lightGray, 0.5));
// 显示刻度标签
grid->showAxis(QwtPolarGrid::AxisAzimuth, true); // 角度标签
grid->showAxis(QwtPolarGrid::AxisLeft, true); // 左侧半径标签
grid->showAxis(QwtPolarGrid::AxisRight, true); // 右侧半径标签
grid->showAxis(QwtPolarGrid::AxisTop, true); // 顶部半径标签
grid->showAxis(QwtPolarGrid::AxisBottom, true); // 底部半径标签
|
3. 极坐标曲线样式
 1
 2
 3
 4
 5
 6
 7
 8
 9
10
11
12
13 | QwtPolarCurve* curve = new QwtPolarCurve();
// 设置曲线样式
curve->setStyle(QwtPolarCurve::Lines); // 连线样式
// 其他样式:NoCurve(无连线)、Dots(散点)
// 设置线条样式
curve->setPen(QPen(Qt::red, 2));
// 设置符号
QwtSymbol* symbol = new QwtSymbol(QwtSymbol::Ellipse,
QBrush(Qt::red), QPen(Qt::darkRed), QSize(5, 5));
curve->setSymbol(symbol);
|
4. 角度范围设置
| // 设置角度范围(例如仅显示0-180度)
polarPlot->setScale(QwtPolar::Azimuth, 0.0, 180.0);
// 设置角度步进
polarPlot->setScaleMaxMajor(QwtPolar::Azimuth, 8); // 8个主刻度(每45度)
// 反转角度方向
polarPlot->setScale(QwtPolar::Azimuth, 360.0, 0.0); // 从360到0递减
|
5. 半径范围设置
| // 设置半径范围
polarPlot->setScale(QwtPolar::Radius, 0.0, 200.0);
// 设置半径刻度
polarPlot->setScaleMaxMajor(QwtPolar::Radius, 5); // 5个主刻度
polarPlot->setScaleMaxMinor(QwtPolar::Radius, 4); // 每区间4个次刻度
// 对数半径刻度
#include <QwtPolarScaleEngine>
polarPlot->setScaleEngine(QwtPolar::Radius, new QwtPolarLogScaleEngine());
|
6. 极坐标标记
1
2
3
4
5
6
7
8
9
10
11
12
13
14
15
16
17
18
19 | #include <QwtPolarMarker>
QwtPolarMarker* marker = new QwtPolarMarker();
// 设置标记位置
marker->setPosition(QwtPointPolar(90.0, 80.0)); // 角度90°,半径80
// 设置标记符号
QwtSymbol* symbol = new QwtSymbol(QwtSymbol::Cross,
Qt::NoBrush, QPen(Qt::red, 2), QSize(10, 10));
marker->setSymbol(symbol);
// 设置标签
QwtText label("关键点");
label.setColor(Qt::red);
marker->setLabel(label);
marker->setLabelAlignment(Qt::AlignCenter);
marker->attach(polarPlot);
|
极坐标轴标识
| 标识 |
枚举值 |
说明 |
| 角度轴 |
QwtPolar::Azimuth |
角度坐标(0-360°) |
| 半径轴 |
QwtPolar::Radius |
半径坐标 |
数据点结构
| // 极坐标点
struct QwtPointPolar {
double azimuth; // 角度(度数)
double radius; // 半径
// 可从笛卡尔坐标转换
QwtPointPolar(const QPointF& point); // 自动计算角度和半径
};
|
核心方法总结
QwtPolarPlot
| 方法 |
说明 |
setScale() |
设置坐标轴范围 |
setScaleMaxMajor() |
设置主刻度数量 |
setScaleMaxMinor() |
设置次刻度数量 |
setScaleEngine() |
设置刻度引擎 |
replot() |
刷新绘图 |
QwtPolarCurve
| 方法 |
说明 |
setSamples() |
设置数据 |
setStyle() |
设置曲线样式 |
setPen() |
设置线条样式 |
setSymbol() |
设置数据点符号 |
极坐标应用场景
- 雷达显示
- 天文数据(星图)
- 方向分布统计
- 天线辐射图
相关示例
- 极坐标演示:
examples/2D/polardemo
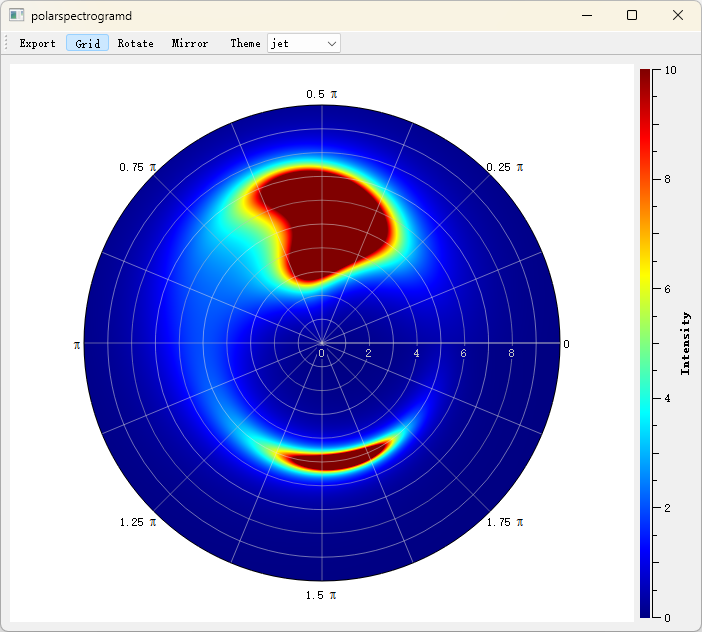
- 极坐标光谱图:
examples/2D/polarspectrogram
极坐标光谱图的例子截图如下: