QwtPyPlot — matplotlib 风格绘图接口
QwtPyPlot 是 Qwt 7 提供的一个高层封装类,为熟悉 matplotlib 的 C++ 用户提供了类似 pyplot 的绘图接口。它内部委托给 QwtFigure、QwtPlot、QwtPlotFactory、QwtPlotStyling 等现有类,不修改任何底层实现。
概述
classDiagram
    class QwtPyPlot {
        +QwtPyPlot(QwtFigure*)
        +QwtPyPlot(QwtPlot*)
        +gcf() QwtFigure*
        +gca() QwtPlot*
        +sca(QwtPlot*)
        +subplot(rows, cols, index)
        +plot(x, y, fmt)
        +scatter(x, y, size, color)
        +bar(values, color)
        +hist(data, bins, color)
        +imshow(data, cmap)
        +contour(data, levels)
        +fillBetween(x, y1, y2)
        +setTitle(title)
        +setXLim(min, max)
        +grid(show)
        +legend()
        +savefig(filename, dpi)
        +show()
    }

    class QwtFormatString {
        +parse(fmt) QwtFormatString
        +color
        +marker
        +lineStyle
        +noLine
    }

    QwtPyPlot ..> QwtFigure : wraps
    QwtPyPlot ..> QwtPlot : operates on
    QwtPyPlot ..> QwtPlotFactory : delegates
    QwtPyPlot ..> QwtPlotStyling : delegates
    QwtPyPlot ..> QwtFormatString : parses
| 类名 |
职责 |
头文件 |
QwtPyPlot |
matplotlib.pyplot 风格的绘图接口 |
<QwtPyPlot> |
QwtFormatString |
matplotlib 格式字符串解析 |
<QwtPyPlot> |
基本概念
QwtPyPlot 维护一个"当前坐标轴"指针(类似 matplotlib 的 gca()),所有绘图方法都作用于当前坐标轴:
| matplotlib 概念 |
QwtPyPlot / Qwt 对应 |
matplotlib.figure.Figure |
QwtFigure |
matplotlib.axes.Axes |
QwtPlot |
pyplot 模块 |
QwtPyPlot 类 |
plt.gcf() / plt.gca() |
QwtPyPlot::gcf() / gca() |
plt.subplot() |
QwtPyPlot::subplot(rows, cols, index) |
fig.savefig() |
QwtPyPlot::savefig(filename, dpi) |
两种使用模式
 1
 2
 3
 4
 5
 6
 7
 8
 9
10
11
12
13
14
15
16
17
18
19
20 | #include <QwtFigure>
#include <QwtPyPlot>
QwtFigure* fig = new QwtFigure;
QwtPyPlot plt(fig);
// 创建 2×1 网格第 1 个子图
plt.subplot(2, 1, 1);
plt.plot(x, y, "r-o", "Temperature");
plt.setTitle("Sensor Data");
plt.grid(true);
plt.legend();
// 创建第 2 个子图
plt.subplot(2, 1, 2);
plt.bar({10, 20, 30, 40}, "b", "Sales");
plt.setYLabel("Value");
plt.savefig("output.png", 300);
fig->show();
|
模式二:QwtPlot 单图模式
| #include <QwtPlot>
#include <QwtPyPlot>
QwtPlot* plot = new QwtPlot;
QwtPyPlot plt(plot);
plt.plot(x, y, "b--");
plt.scatter(x2, y2, 50, "r");
plt.setTitle("Quick Plot");
plot->show();
|
格式字符串
QwtFormatString 解析 matplotlib 风格的格式字符串,支持颜色、标记和线型的组合:
| 格式:[颜色][线型][标记]
示例:"r-o" → 红色实线 + 圆圈标记
"b--" → 蓝色虚线
"g^:" → 绿色点线 + 上三角标记
"ko" → 黑色圆圈(无线)
|
颜色字符
| 字符 |
颜色 |
字符 |
颜色 |
b |
蓝色 |
m |
洋红 |
g |
绿色 |
y |
黄色 |
r |
红色 |
k |
黑色 |
c |
青色 |
w |
白色 |
标记字符
| 字符 |
标记 |
字符 |
标记 |
o |
圆圈 |
x |
叉号 |
s |
方块 |
+ |
加号 |
^ |
上三角 |
* |
星号 |
v |
下三角 |
. |
点 |
D |
菱形 |
|
|
线型
| 符号 |
线型 |
- |
实线 |
-- |
虚线 |
-. |
点划线 |
: |
点线 |
matplotlib 行为兼容
当只指定标记而没有线型时(如 "ro"),线条会自动隐藏,仅显示标记点。这与 matplotlib 的行为一致。
绘图方法
基础绘图
plot() — 线图
| // y-only(x 自动为 0, 1, 2, ...)
plt.plot({1, 4, 2, 5}, "r-o");
// x-y 数据
plt.plot(x, y, "b--", "Label");
// QPointF 数据
QVector<QPointF> data = {{0,1}, {1,3}, {2,2}};
plt.plot(data, "g^:");
|
scatter() — 散点图
| // 参数:x, y, 标记大小, 颜色, 标签
plt.scatter(x1, y1, 30, "r", "Group A");
plt.scatter(x2, y2, 50, "b", "Group B");
|
bar() — 柱状图
| // y-only 值(x 自动为索引)
plt.bar({10, 20, 30, 40}, "c");
// x-y 数据 + 宽度
plt.bar(x, values, 0.8, "b", "Sales");
|
hist() — 直方图
| // 自动分箱(默认 10 个 bins)
plt.hist(data, 20, "m", "Distribution");
|
imshow() — 热图
| // 2D 矩阵数据,支持多种 colormap
QVector<QVector<double>> matrix = ...;
plt.imshow(matrix, "viridis");
|
支持的 colormap:"viridis", "hot", "cool", "jet", "gray"
contour() — 等高线
| // 自动 10 条等高线
plt.contour(data);
// 自定义等高线级别
plt.contour(data, {0.2, 0.4, 0.6, 0.8}, "hot");
|
fillBetween() — 填充区域
| // 参数:x, y1, y2, 颜色, 透明度
plt.fillBetween(x, yLower, yUpper, "blue", 0.3);
|
errorbar() — 误差棒
| plt.errorbar(x, y, yerr, "r-", "Measurement");
|
quiver() — 向量场
| plt.quiver(x, y, u, v, "k");
|
candlestick() — K 线图
| QVector<QwtOHLCSample> ohlcData = ...;
plt.candlestick(ohlcData, "Stock");
|
装饰元素
| 方法 |
说明 |
示例 |
grid(show, minor) |
网格线 |
plt.grid(true, true) |
axhline(y, fmt) |
水平参考线 |
plt.axhline(0, "k--") |
axvline(x, fmt) |
垂直参考线 |
plt.axvline(5, "r:") |
axhspan(y1, y2, color, alpha) |
水平区域高亮 |
plt.axhspan(2, 4, "yellow", 0.2) |
axvspan(x1, x2, color, alpha) |
垂直区域高亮 |
plt.axvspan(3, 7, "blue", 0.1) |
legend(loc) |
图例 |
plt.legend() |
annotate(text, xy, xytext) |
箭头标注 |
plt.annotate("Peak", peak, label) |
坐标轴配置
标题与标签
| plt.setTitle("My Plot");
plt.setXLabel("Time (s)");
plt.setYLabel("Amplitude");
|
轴范围与缩放
| // 设置轴范围
plt.setXLim(0, 100);
plt.setYLim(-5, 5);
// 对数坐标
plt.setXScale("log");
plt.setYScale("log");
// 恢复线性
plt.setXScale("linear");
|
刻度
| // 自定义刻度位置
plt.setXTicks({0, 2.5, 5, 7.5, 10});
plt.setYTicks({-1, 0, 1});
// 反转坐标轴
plt.invertXAxis();
plt.invertYAxis();
|
子图布局
| QwtFigure* fig = new QwtFigure;
QwtPyPlot plt(fig);
// subplot(rows, cols, index) — 1-based 索引
plt.subplot(2, 2, 1); // 第 1 行第 1 列
plt.subplot(2, 2, 2); // 第 1 行第 2 列
plt.subplot(2, 1, 2); // 第 2 行跨 2 列(需要重新 addGridAxes)
|
寄生轴(双 Y/X 轴)
| plt.subplot(1, 1, 1);
plt.plot(x, temp, "r-", "Temperature");
plt.setYLabel("°C");
// 创建右侧 Y 轴
QwtPlot* ax2 = plt.twinx();
plt.sca(ax2); // 切换到新轴
plt.plot(x, humidity, "b--", "Humidity");
plt.setYLabel("%");
|
紧凑布局
| plt.tightLayout(); // 对齐所有子图的 Y 轴
|
外观设置
| // 设置 Figure 背景色
plt.setFaceColor("lightgray");
// 设置画布背景色
plt.setAxesColor("white");
|
输出与交互
保存图片
| plt.savefig("output.png"); // 默认 DPI
plt.savefig("output.png", 300); // 300 DPI
|
显示窗口
交互控制
| plt.enablePan(true); // 启用拖拽平移
plt.enableZoom(true); // 启用框选缩放
|
完整示例
以下示例展示了一个多子图应用,包含线图、散点图和直方图:
 1
 2
 3
 4
 5
 6
 7
 8
 9
10
11
12
13
14
15
16
17
18
19
20
21
22
23
24
25
26
27
28
29
30
31
32
33
34
35
36
37
38
39
40
41
42
43
44
45 | #include <QApplication>
#include <QwtFigure>
#include <QwtPyPlot>
#include <cmath>
int main(int argc, char* argv[])
{
QApplication app(argc, argv);
QwtFigure* fig = new QwtFigure;
QwtPyPlot plt(fig);
// 生成数据
QVector<double> x, sinY, cosY;
for (int i = 0; i <= 100; i++) {
double t = i * 0.1;
x.append(t);
sinY.append(std::sin(t));
cosY.append(std::cos(t));
}
// 子图 1:线图
plt.subplot(2, 1, 1);
plt.plot(x, sinY, "r-", "sin(x)");
plt.plot(x, cosY, "b--", "cos(x)");
plt.setTitle("Trigonometric Functions");
plt.grid(true);
plt.legend();
// 子图 2:直方图
plt.subplot(2, 1, 2);
QVector<double> randomData;
for (int i = 0; i < 500; i++) {
randomData.append(std::sin(i * 0.1) * 10 + (i % 7));
}
plt.hist(randomData, 20, "c");
plt.setTitle("Distribution");
plt.tightLayout();
plt.savefig("demo.png", 300);
fig->resize(800, 600);
fig->show();
return app.exec();
}
|
API 参考
构造与状态
| 方法 |
说明 |
QwtPyPlot(QwtFigure*) |
构造:多图模式 |
QwtPyPlot(QwtPlot*) |
构造:单图模式 |
gcf() |
获取当前 Figure |
gca() |
获取当前坐标轴 |
sca(QwtPlot*) |
设置当前坐标轴 |
绘图方法
| 方法 |
返回类型 |
说明 |
plot(y, fmt, label) |
QwtPlotCurve* |
y-only 线图 |
plot(x, y, fmt, label) |
QwtPlotCurve* |
x-y 线图 |
plot(data, fmt, label) |
QwtPlotCurve* |
QPointF 线图 |
scatter(x, y, size, color, label) |
QwtPlotCurve* |
散点图 |
bar(values, color, label) |
QwtPlotBarChart* |
柱状图 |
bar(x, values, width, color, label) |
QwtPlotBarChart* |
x-y 柱状图 |
hist(data, bins, color, label) |
QwtPlotHistogram* |
直方图 |
boxplot(data, label) |
QwtPlotBoxChart* |
箱线图 |
fillBetween(x, y1, y2, color, alpha) |
QwtPlotIntervalCurve* |
填充区域 |
errorbar(x, y, yerr, fmt, label) |
QwtPlotIntervalCurve* |
误差棒 |
imshow(data, cmap, vmin, vmax) |
QwtPlotSpectrogram* |
热图 |
contour(data, levels, cmap) |
QwtPlotSpectrogram* |
等高线 |
quiver(x, y, u, v, color) |
QwtPlotVectorField* |
向量场 |
candlestick(data, label) |
QwtPlotTradingCurve* |
K 线图 |
坐标轴配置
| 方法 |
说明 |
setTitle(title) |
设置图表标题 |
setXLabel(label) |
设置 X 轴标签 |
setYLabel(label) |
设置 Y 轴标签 |
setXLim(min, max) |
设置 X 轴范围 |
setYLim(min, max) |
设置 Y 轴范围 |
setXScale(scale) |
设置 X 轴缩放("linear" / "log") |
setYScale(scale) |
设置 Y 轴缩放 |
setXTicks(ticks, labels) |
设置 X 轴刻度 |
setYTicks(ticks, labels) |
设置 Y 轴刻度 |
invertXAxis() |
反转 X 轴 |
invertYAxis() |
反转 Y 轴 |
| 方法 |
说明 |
subplot(rows, cols, index) |
创建子图(1-based 索引) |
addAxes(rect) |
在归一化坐标位置添加坐标轴 |
twinx(host) |
创建双 Y 轴 |
twiny(host) |
创建双 X 轴 |
tightLayout() |
紧凑布局 |
输出与交互
| 方法 |
说明 |
savefig(filename, dpi) |
保存图片 |
show() |
显示窗口 |
enablePan(enable) |
启用/禁用平移 |
enableZoom(enable) |
启用/禁用缩放 |
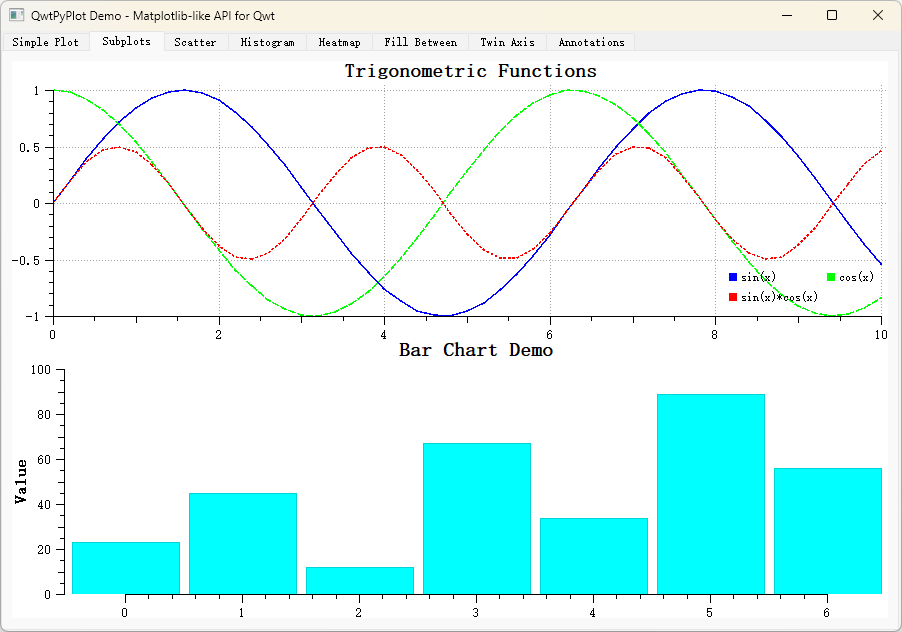
相关示例
完整示例位于 examples/2D/pyplot/ 目录,包含 8 个 Tab 页展示各种 QwtPyPlot 功能。
PyPlot 的例子截图如下: