使用 OpenGL
QWT 通过 OpenGL 画布提供硬件加速渲染。本页介绍 CMake 配置以及 QwtPlotOpenGLCanvas 的使用方法。
CMake 配置
如果你使用 OpenGL,需要在 CMake 中添加 OpenGL 模块的引入:
1 2 3 4 5 6 7 8 9 10 11 12 13 14 15 16 | |
QwtPlotOpenGLCanvas
QwtPlotOpenGLCanvas 是继承自 QOpenGLWidget 的画布控件。它直接在 GPU 上渲染绘图内容,相比默认的 QwtPlotCanvas,在处理大数据集和实时更新时性能显著提升。
基本用法
将默认画布替换为 OpenGL 画布:
1 2 3 4 5 6 7 8 9 10 11 12 13 14 15 16 | |
自定义表面格式
可以传入自定义的 QSurfaceFormat 进行高级 OpenGL 配置:
1 2 3 4 5 6 | |
画布属性
QwtPlotOpenGLCanvas 虽然不是继承自 QFrame,但模仿了 QFrame 的 API:
| 属性 | 类型 | 说明 |
|---|---|---|
frameShadow |
QFrame::Shadow |
边框阴影样式(Plain、Raised、Sunken) |
frameShape |
QFrame::Shape |
边框形状(NoFrame、Box、Panel 等) |
lineWidth |
int |
边框线宽(像素) |
midLineWidth |
int |
Panel 形状时中间线的宽度 |
borderRadius |
double |
圆角边框的圆角半径 |
替代方案:QwtPlotCanvas + OpenGL 缓冲
如果你更倾向使用标准的 QwtPlotCanvas 但又想获得硬件加速,可以使用 OpenGLBuffer 绘制模式:
1 2 3 | |
Info
QwtPlotOpenGLCanvas 直接渲染到 QOpenGLWidget,通常比 OpenGLBuffer 方案性能更好。不过 OpenGLBuffer 在包含复杂混合排布的桌面应用中集成更顺畅。
何时使用 OpenGL 画布
| 场景 | 推荐方案 |
|---|---|
| 静态或小数据集(<1万点) | 默认 QwtPlotCanvas 即可 |
| 大数据集(>10万点) | QwtPlotOpenGLCanvas,交互更流畅 |
| 实时流式数据 | QwtPlotOpenGLCanvas,帧率更稳定 |
| 复杂布局的混合控件 UI | QwtPlotCanvas + OpenGLBuffer,集成更友好 |
相关示例
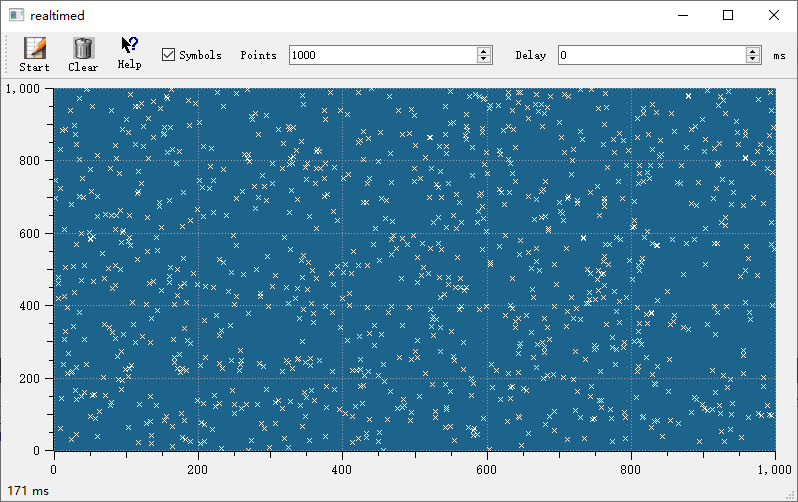
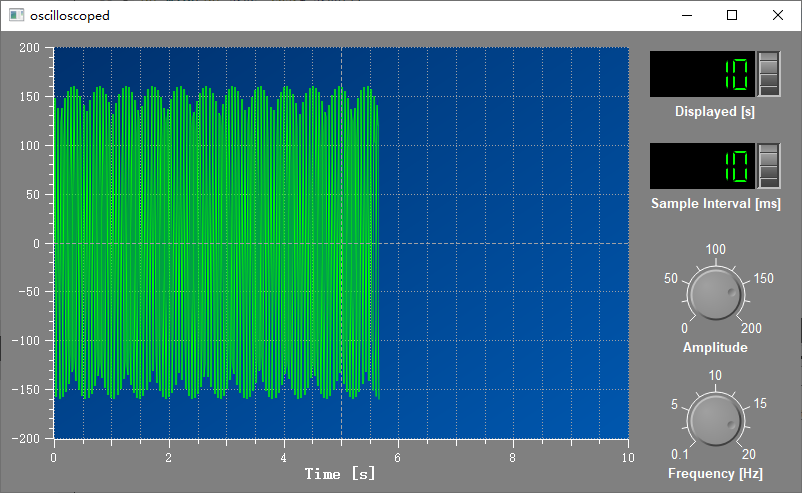
examples/realtime— 高吞吐量的实时绘图examples/oscilloscope— 示波器风格的波形显示
实时绘图与示波器的例子截图如下: