QWT — Qt 绘图库
QWT(Qt Widgets for Technical Applications)是一个基于 Qt 的高性能 2D/3D 绘图库,适用于科学计算和工程应用中的数据可视化。
为什么选择 QWT?
Qt 生态里能画图的库不多,主流的有 QCustomPlot、Qwt、Qt Charts 和 KDChart。Qt 6.8 之后把原来的 Qt Charts(2D)与 Qt DataVisualization(3D)合并为统一的 Qt Graphs 模块,底层全部基于 Qt Quick Scene Graph + Qt Quick 3D,放弃了老旧的 Graphics-View/QPainter 管线。不过 Qt Graphs 必须通过 QQuickWidget 或 QQuickWindow 嵌入,必须带 QML runtime,C++ 支持不足,且不支持 Win7 等老系统,对嵌入式也不友好。
| 库 |
协议 |
优势 |
劣势 |
| QCustomPlot |
GPL |
简单易用,开箱即用 |
GPL 传染性,商业不友好 |
| Qwt |
LGPL |
性能优越,架构合理 |
原作者停止更新,部署较难 |
| Qt Charts |
GPL |
Qt 官方 |
效率低,GPL 协议 |
| KDChart |
MIT (3.0+) |
商业友好 |
渲染效果一般 |
本项目基于 Qwt 6.2.0 进行维护和改进,添加了现代化功能和修复,使其成为协议友好、性能优越、方便使用的 Qt 绘图库。
Qwt 7.0 新特性
快速集成
项目地址
效果展示
基本图表
-
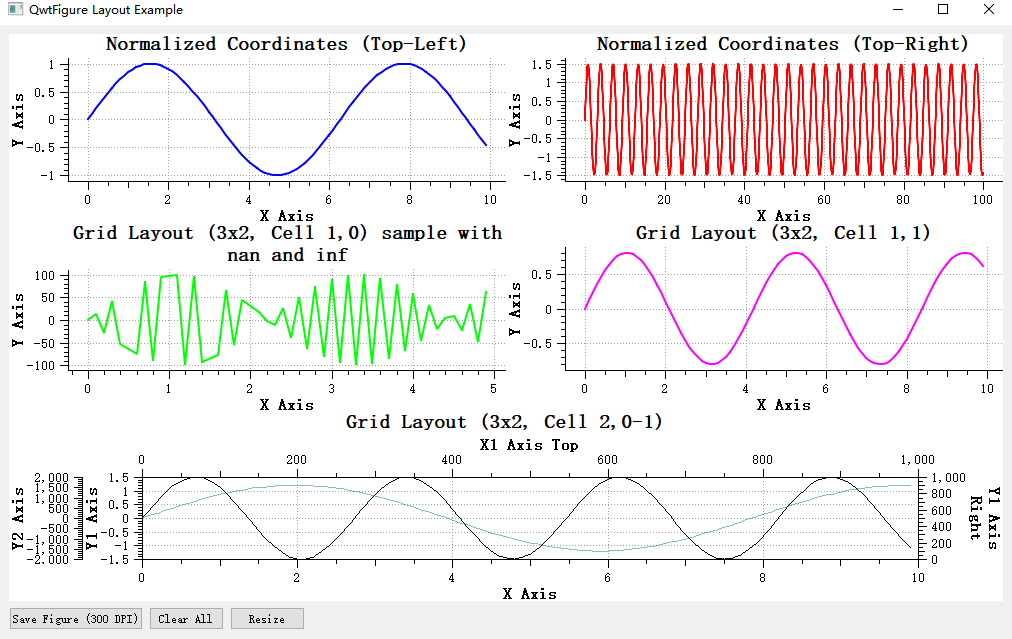
examples/figure
-
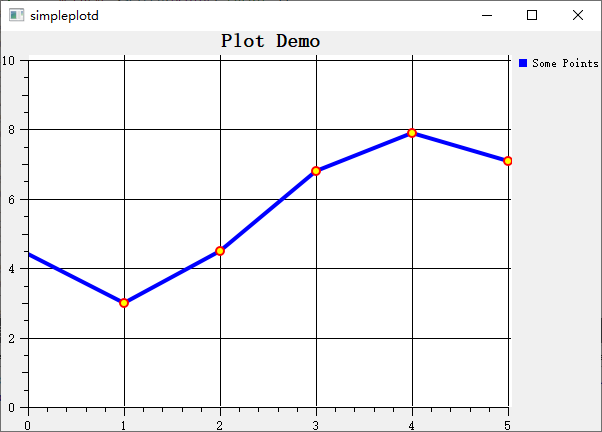
examples/2D/simpleplot
-
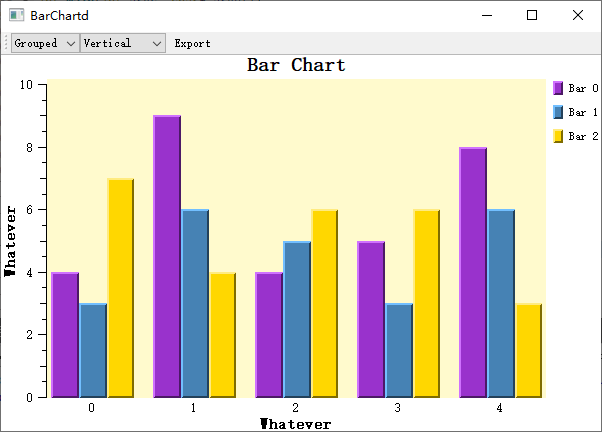
examples/2D/barchart
-
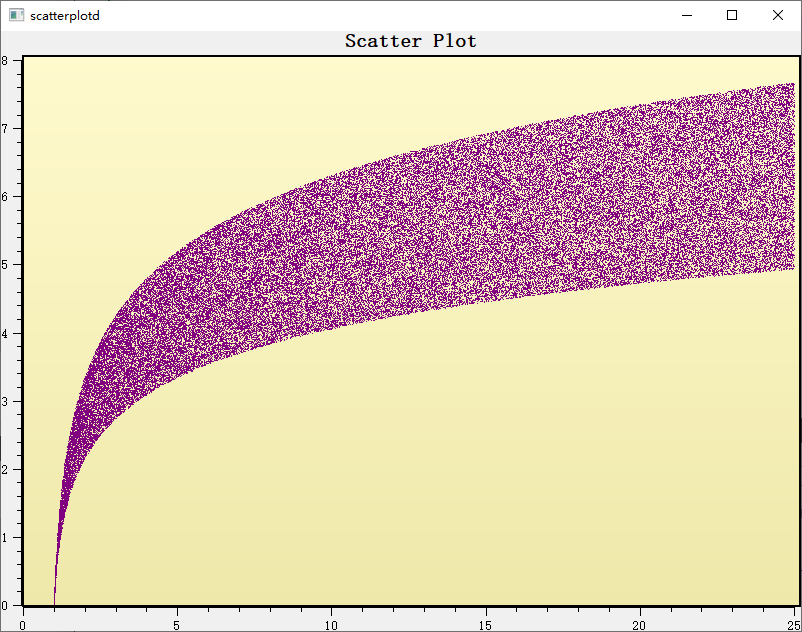
examples/2D/scatterplot
-
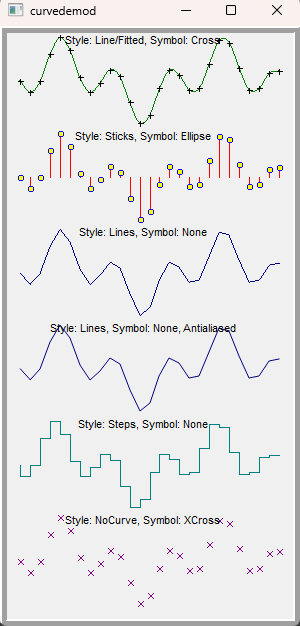
examples/2D/curvedemo
-
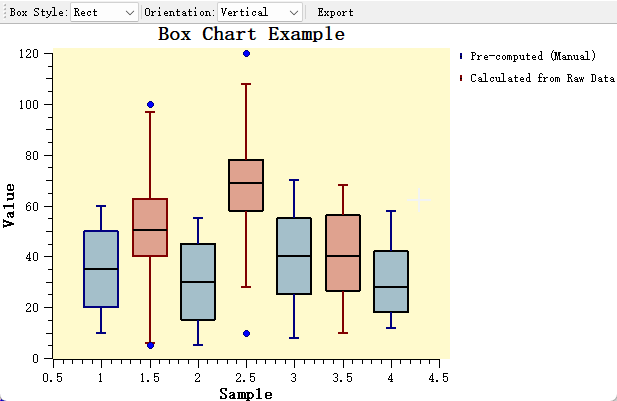
examples/2D/boxchart
实时可视化
-
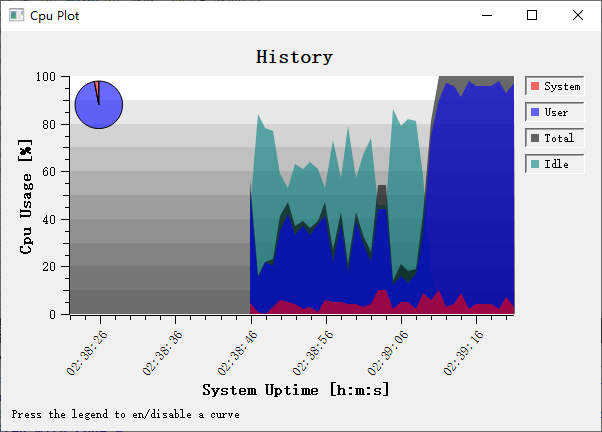
examples/2D/cpuplot
-
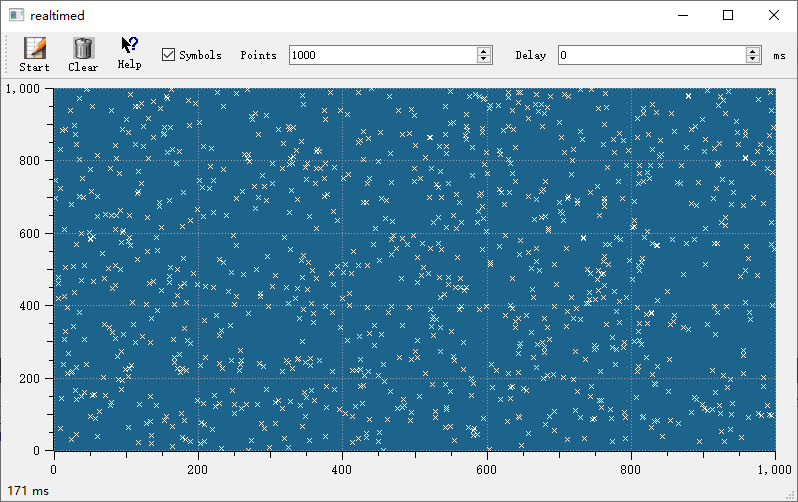
examples/2D/realtime
-
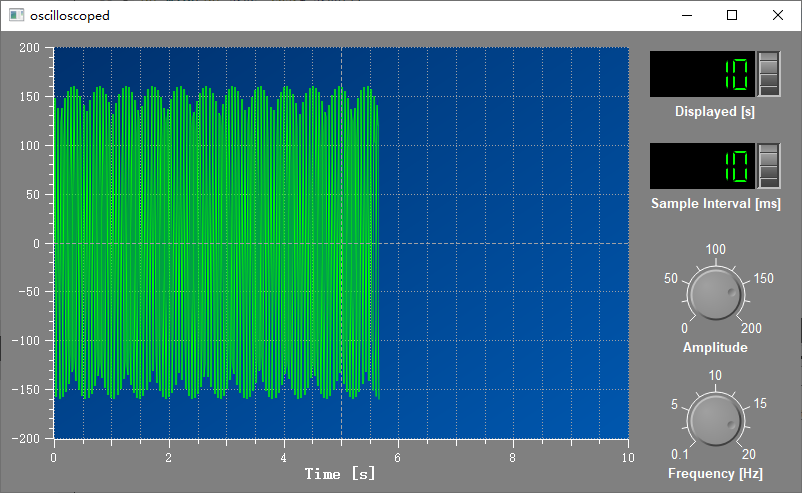
examples/2D/oscilloscope
-
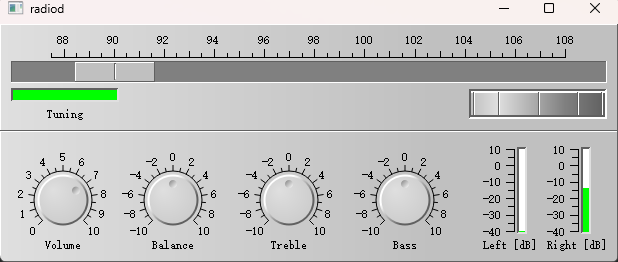
examples/2D/radio
-
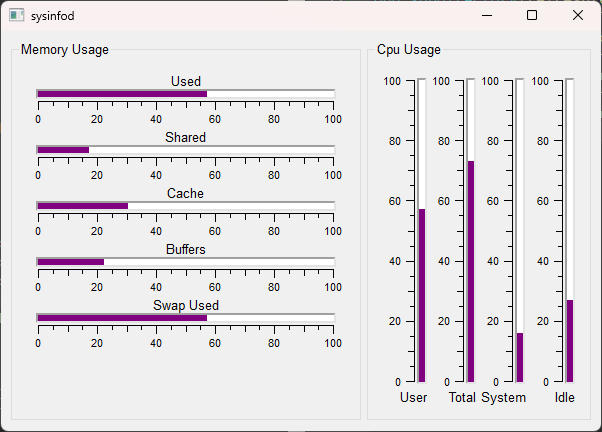
examples/2D/sysinfo
-
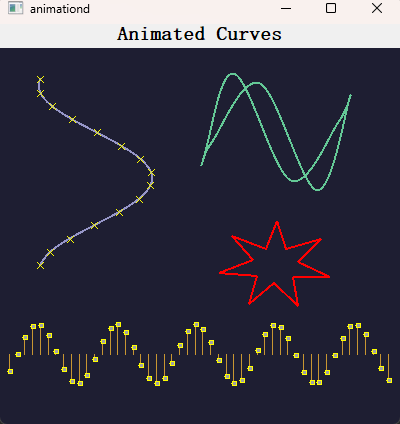
examples/2D/animation
高级图表
-
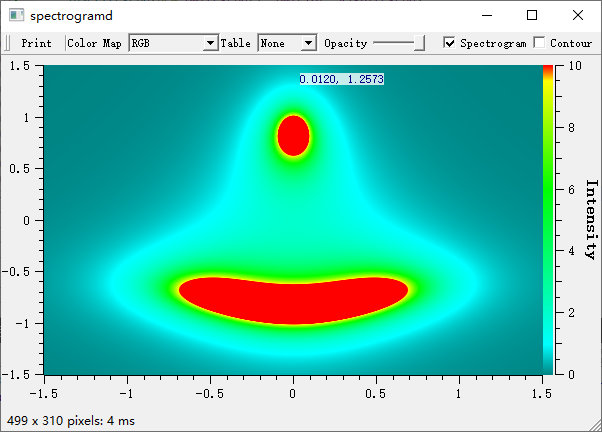
examples/2D/spectrogram
-
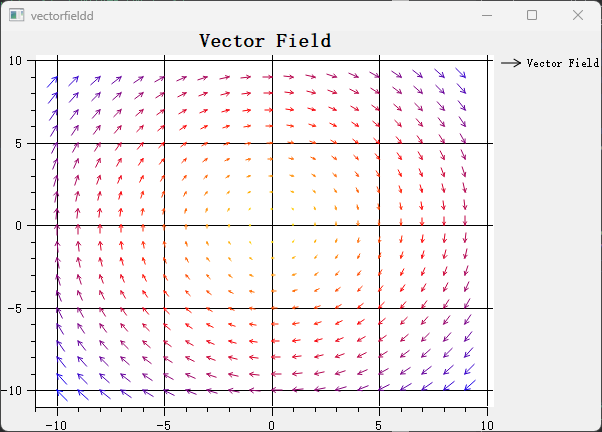
playground/vectorfield
-
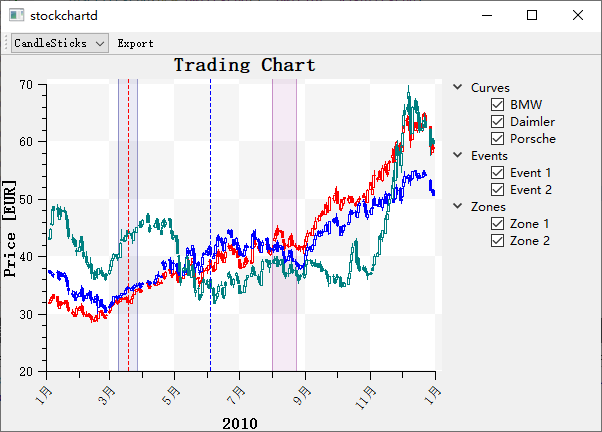
examples/2D/stockchart
-
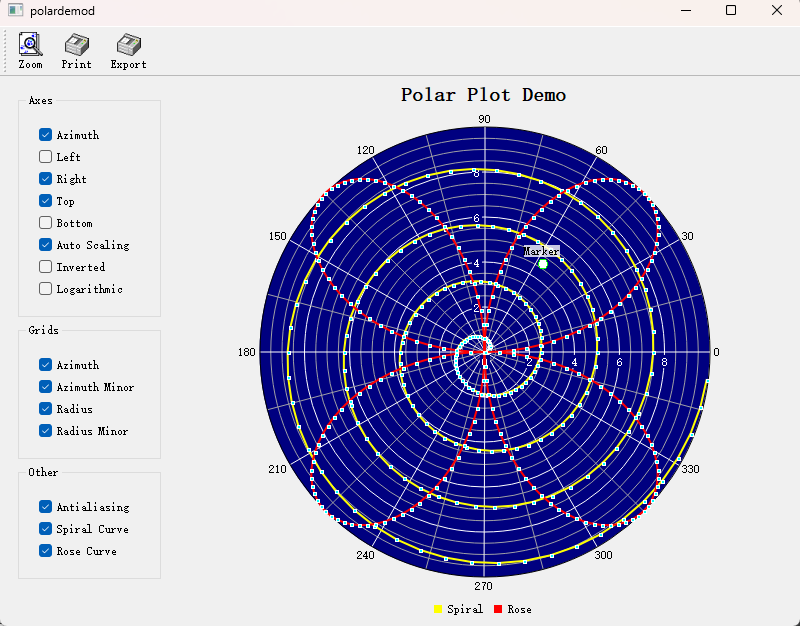
examples/2D/polardemo
-
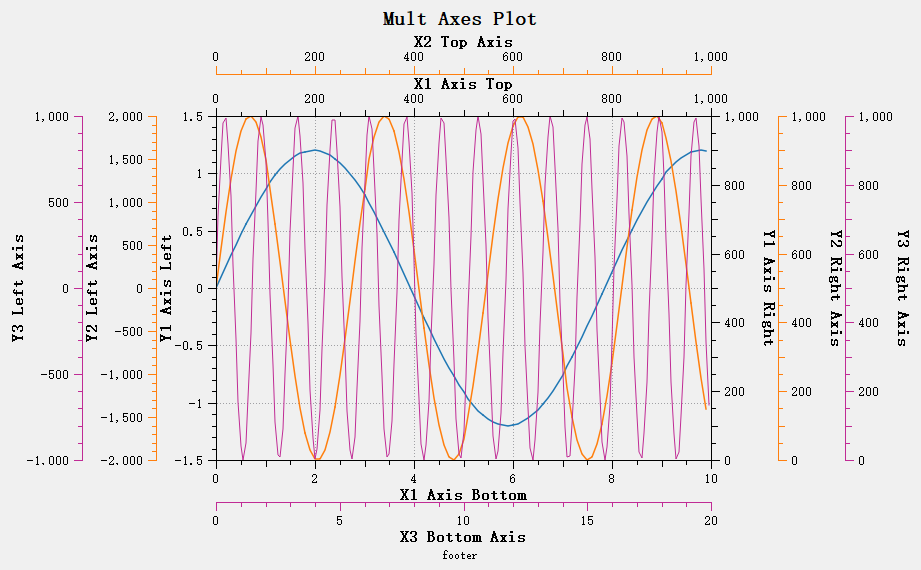
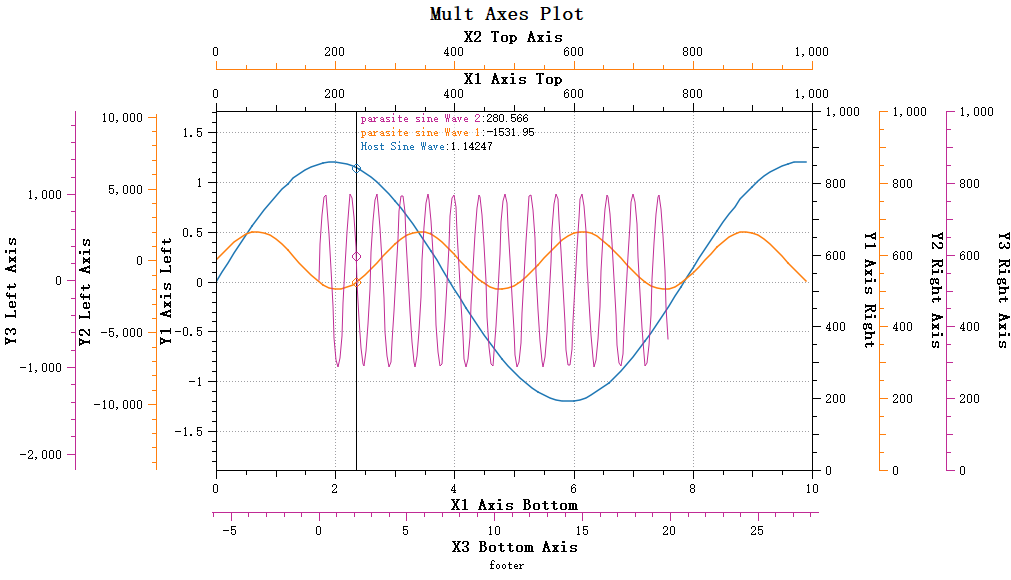
examples/parasitePlot
-
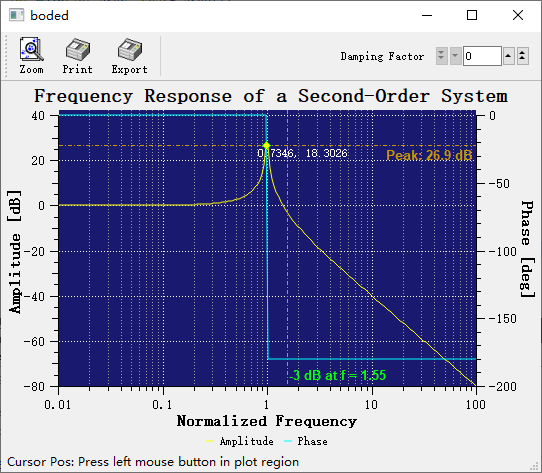
examples/2D/bode
-
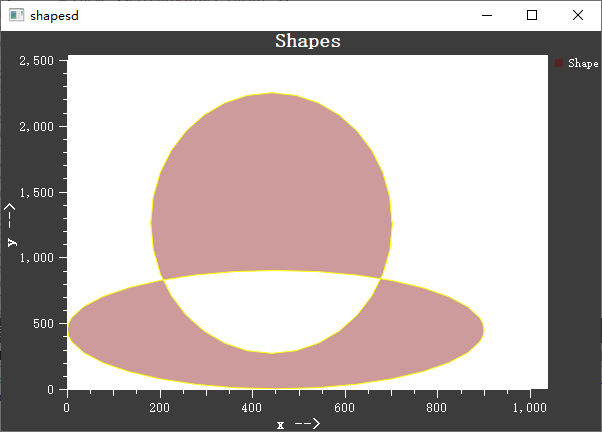
playground/shapes
-
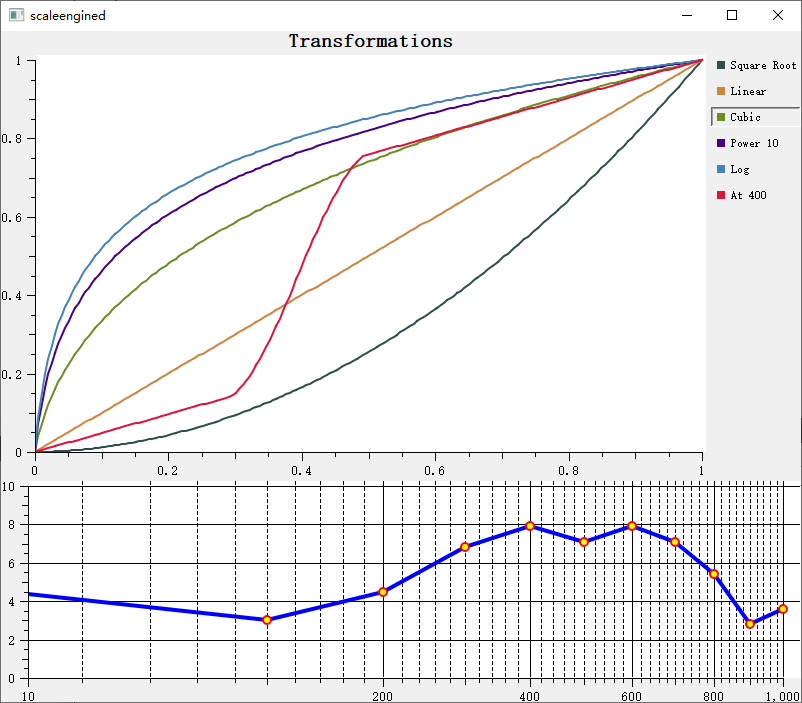
playground/scaleengine
-
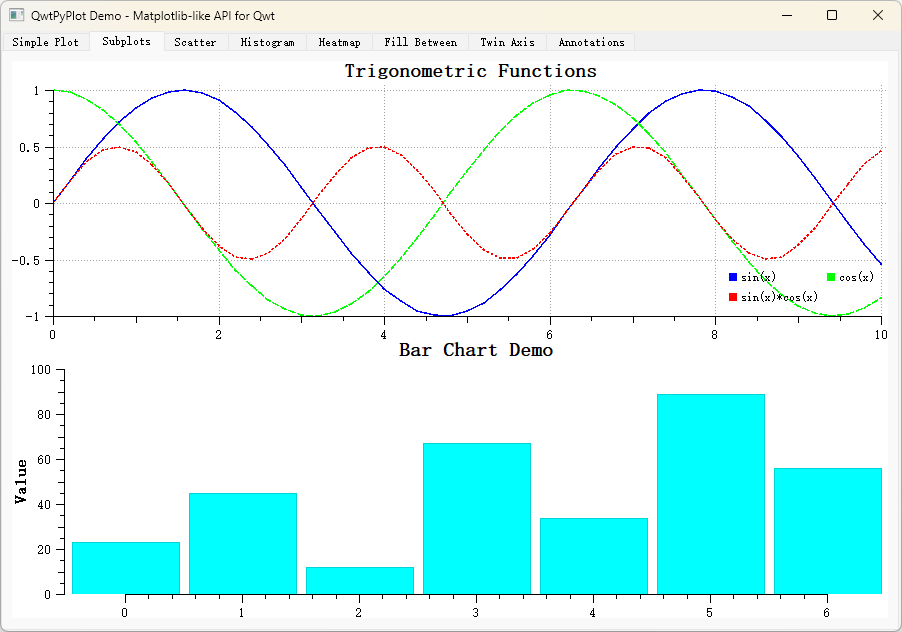
examples/2D/pyplot
其他示例
-
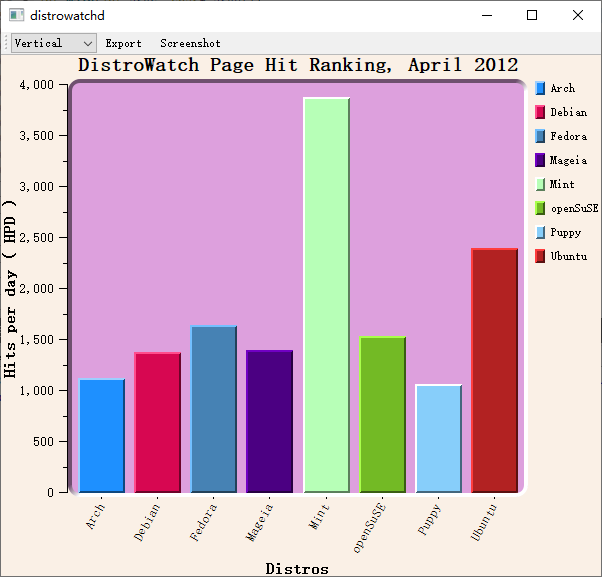
examples/2D/distrowatch
-
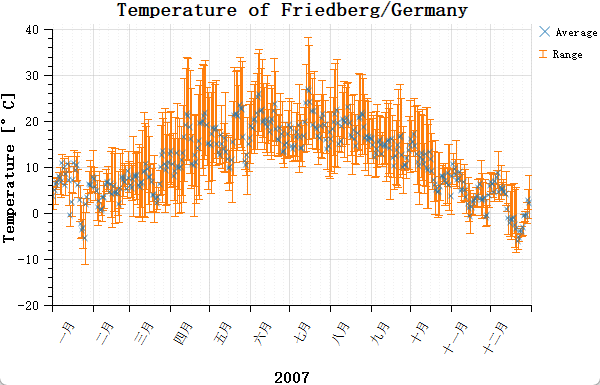
examples/2D/friedberg
-
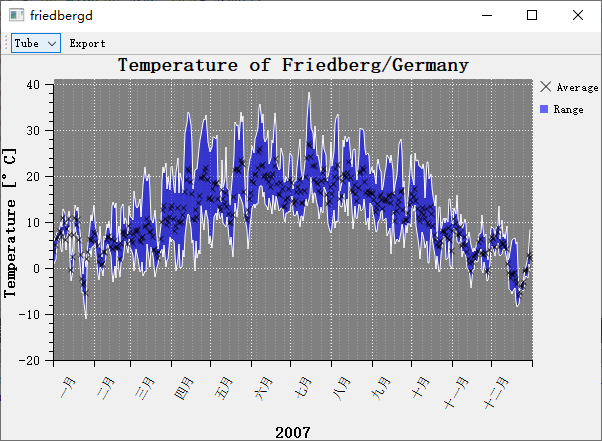
examples/2D/friedberg
-
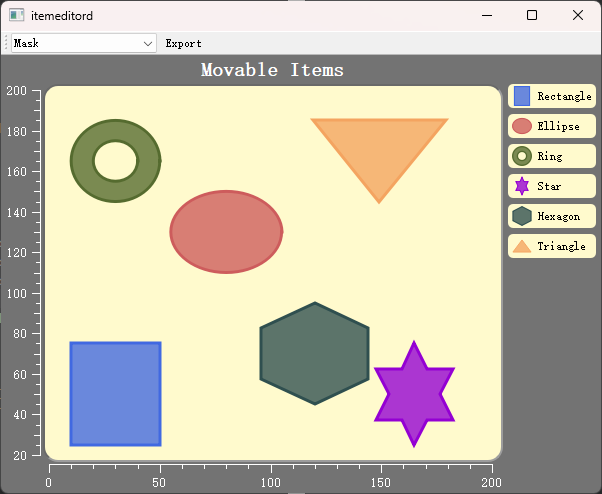
examples/2D/itemeditor
-
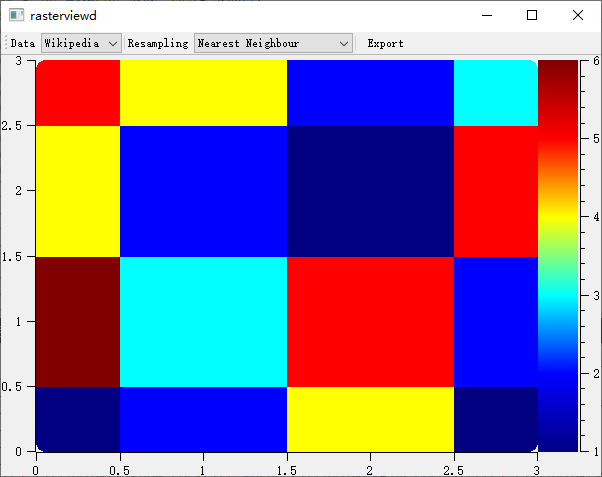
examples/2D/rasterview
-
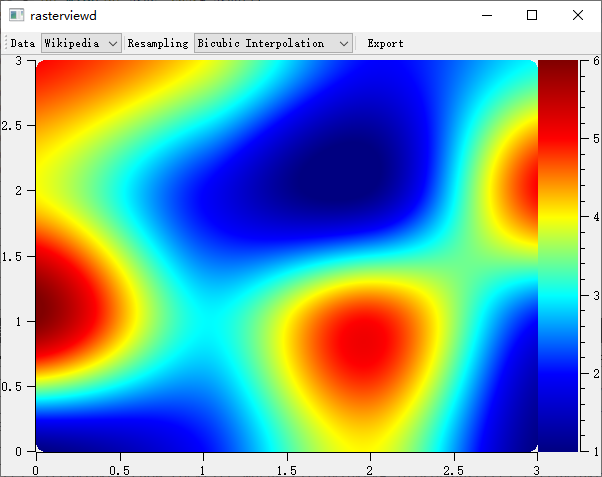
examples/2D/rasterview
-
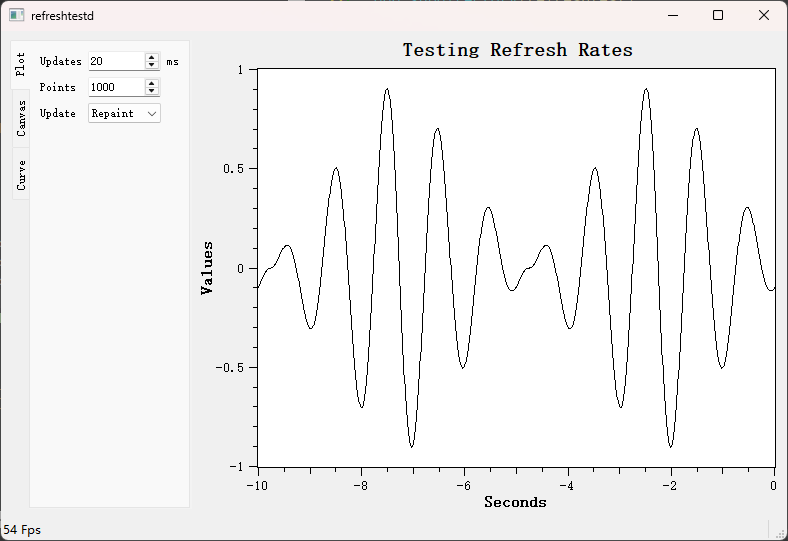
examples/2D/refreshtest
-
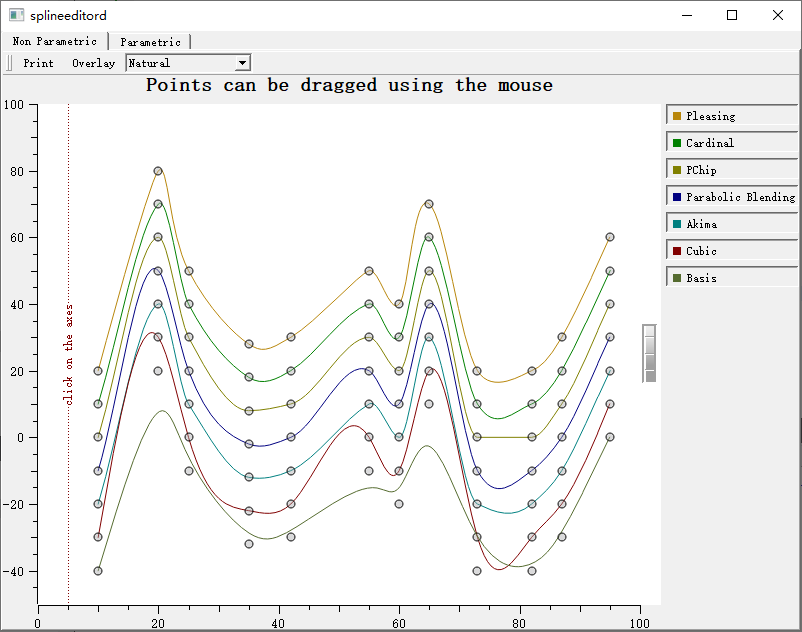
examples/2D/splineeditor
-
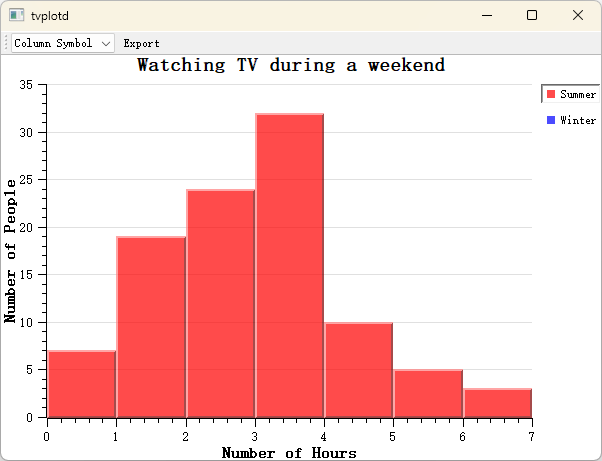
examples/2D/tvplot
-
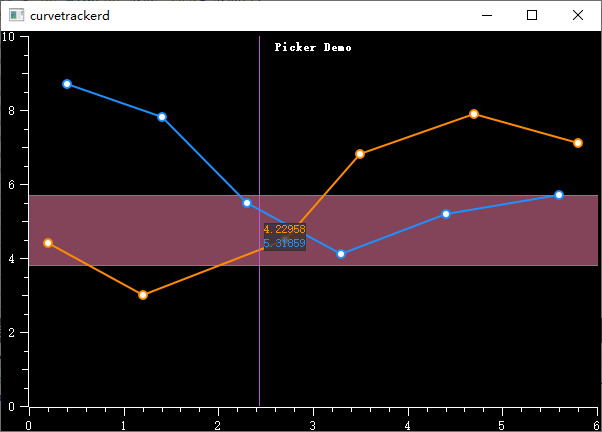
playground/curvetracker
-
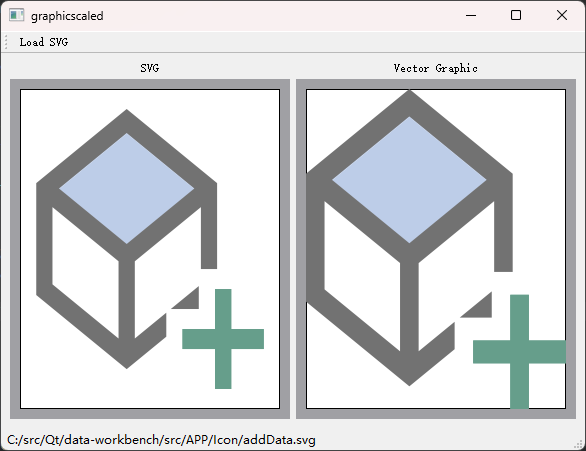
playground/graphicscale
-
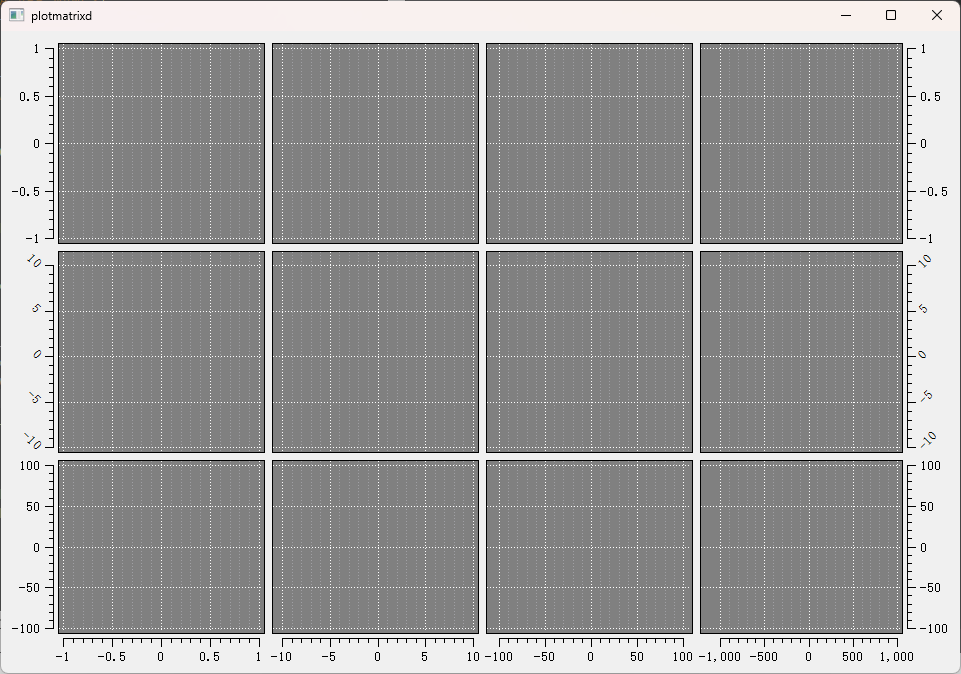
playground/plotmatrix
-
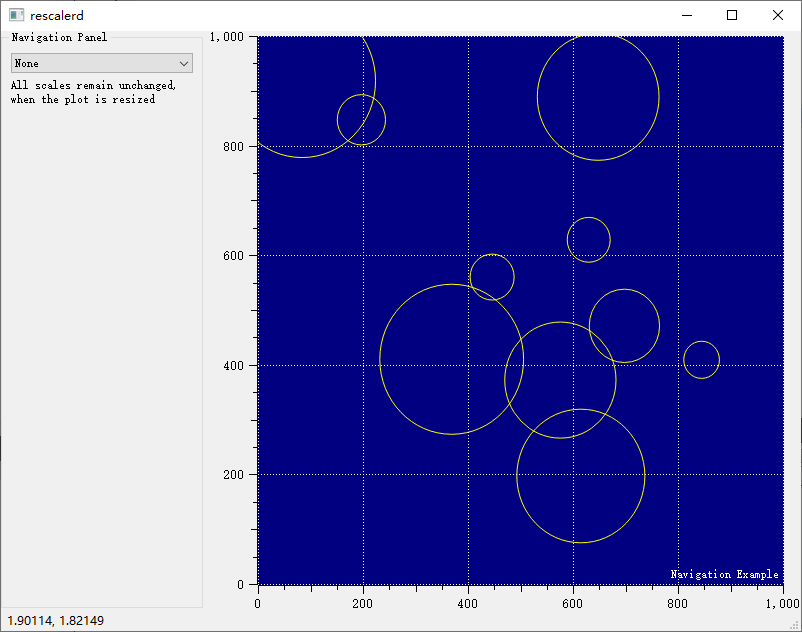
playground/rescaler
-
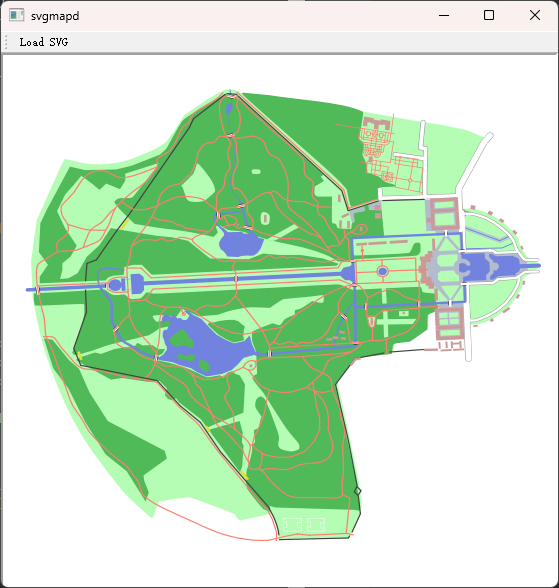
playground/svgmap
-
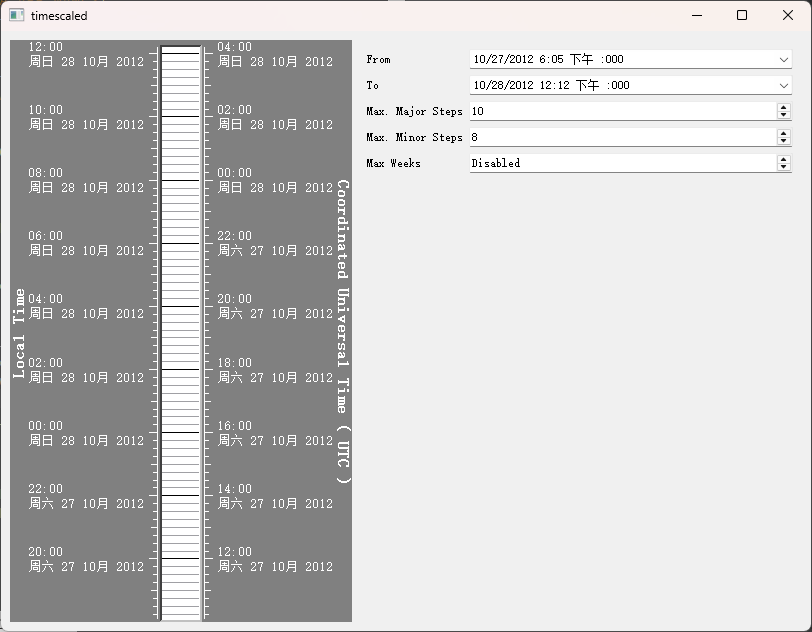
playground/timescale
交互演示
-
坐标轴拖动
-
坐标轴缩放
-
Figure 交互蒙版
-
数据拾取器
版权信息
| Qwt Widget Library
Copyright (C) 1997 Josef Wilgen
Copyright (C) 2002 Uwe Rathmann
Qwt is published under the Qwt License, Version 1.0.
|