QwtPlotBarChart displays a series of values as bars. More...
#include <qwt_plot_barchart.h>
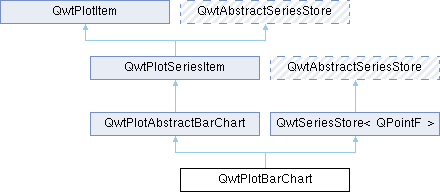
Classes | |
| class | PrivateData |
Public Member Functions | |
| QwtPlotBarChart (const QString &title=QString()) | |
| QwtPlotBarChart (const QwtText &title) | |
| Constructor. | |
| virtual int | rtti () const override |
| Get the runtime type information. | |
| void | attach (QwtPlot *plot) override |
| Attach the bar chart to a plot. | |
| void | setSamples (const QVector< QPointF > &) |
| Initialize data with an array of points. | |
| void | setSamples (const QVector< double > &) |
| Initialize data with an array of doubles. | |
| void | setSamples (QwtSeriesData< QPointF > *) |
| Assign a series of samples. | |
| void | setSymbol (QwtColumnSymbol *) |
| Assign a symbol. | |
| const QwtColumnSymbol * | symbol () const |
| Get the current symbol. | |
| void | setPen (const QPen &p) |
| Set the bar symbol pen. | |
| QPen | pen () const |
| Get the bar symbol pen. | |
| void | setBrush (const QBrush &b) |
| Set the bar symbol brush. | |
| QBrush | brush () const |
| Get the bar symbol brush. | |
| void | setFrameStyle (QwtColumnSymbol::FrameStyle f) |
| Set the bar symbol frame style. | |
| QwtColumnSymbol::FrameStyle | frameStyle () const |
| Get the bar symbol frame style. | |
| void | setLegendMode (LegendMode) |
| Set the mode that decides what to display on the legend. | |
| LegendMode | legendMode () const |
| Get the legend mode. | |
| virtual void | drawSeries (QPainter *, const QwtScaleMap &xMap, const QwtScaleMap &yMap, const QRectF &canvasRect, int from, int to) const override |
| Draw an interval of the bar chart. | |
| virtual QRectF | boundingRect () const override |
| Get the bounding rectangle of all samples. | |
| virtual QwtColumnSymbol * | specialSymbol (int sampleIndex, const QPointF &) const |
| Get a special symbol for a specific sample. | |
| virtual QwtText | barTitle (int sampleIndex) const |
| Return the title of a bar. | |
 Public Member Functions inherited from QwtPlotAbstractBarChart Public Member Functions inherited from QwtPlotAbstractBarChart | |
| QwtPlotAbstractBarChart (const QwtText &title) | |
| Constructor. | |
| void | setLayoutPolicy (LayoutPolicy) |
| Set the layout policy. | |
| LayoutPolicy | layoutPolicy () const |
| Get the layout policy. | |
| void | setLayoutHint (double) |
| Set the layout hint. | |
| double | layoutHint () const |
| Get the layout hint. | |
| void | setSpacing (int) |
| Set the spacing between bars. | |
| int | spacing () const |
| Get the spacing between bars. | |
| void | setMargin (int) |
| Set the margin around the bars. | |
| int | margin () const |
| Get the margin around the bars. | |
| void | setBaseline (double) |
| Set the baseline value. | |
| double | baseline () const |
| Get the baseline value. | |
| virtual void | getCanvasMarginHint (const QwtScaleMap &xMap, const QwtScaleMap &yMap, const QRectF &canvasRect, double &left, double &top, double &right, double &bottom) const override |
| Calculate a hint for the canvas margin. | |
| Public Member Functions inherited from QwtPlotSeriesItem | |
| QwtPlotSeriesItem (const QString &title=QString()) | |
| QwtPlotSeriesItem (const QwtText &title) | |
| Constructor. | |
| void | setOrientation (Qt::Orientation) |
| Set the orientation of the item. | |
| Qt::Orientation | orientation () const |
| Get the orientation of the plot item. | |
| virtual void | draw (QPainter *, const QwtScaleMap &xMap, const QwtScaleMap &yMap, const QRectF &canvasRect) const override |
| Draw the complete series. | |
| virtual void | updateScaleDiv (const QwtScaleDiv &, const QwtScaleDiv &) override |
| Update the scale divisions. | |
| Public Member Functions inherited from QwtPlotItem | |
| QwtPlotItem () | |
| Default constructor. | |
| QwtPlotItem (const QString &title) | |
| Constructor with title as QString. | |
| QwtPlotItem (const QwtText &title) | |
| Constructor with title as QwtText. | |
| virtual | ~QwtPlotItem () |
| Destructor. | |
| void | detach () |
| Detach the item from the plot. | |
| QwtPlot * | plot () const |
| Get the plot the item is attached to. | |
| void | setTitle (const QString &title) |
| Set the title using a QString. | |
| void | setTitle (const QwtText &title) |
| Set the title using a QwtText. | |
| const QwtText & | title () const |
| Get the title. | |
| void | setItemAttribute (ItemAttribute, bool on=true) |
| Set an item attribute. | |
| bool | testItemAttribute (ItemAttribute) const |
| Test an item attribute. | |
| void | setItemInterest (ItemInterest, bool on=true) |
| Set an item interest. | |
| bool | testItemInterest (ItemInterest) const |
| Test an item interest. | |
| void | setRenderHint (RenderHint, bool on=true) |
| Set a render hint. | |
| bool | testRenderHint (RenderHint) const |
| Test a render hint. | |
| void | setRenderThreadCount (uint numThreads) |
| Set the number of render threads. | |
| uint | renderThreadCount () const |
| Get the number of render threads. | |
| void | setLegendIconSize (const QSize &) |
| Set the legend icon size. | |
| QSize | legendIconSize () const |
| Get the legend icon size. | |
| double | z () const |
| Get the z-value. | |
| void | setZ (double z) |
| Set the z-value. | |
| void | show () |
| Show the item. | |
| void | hide () |
| Hide the item. | |
| virtual void | setVisible (bool) |
| Set the visibility. | |
| bool | isVisible () const |
| Check if the item is visible. | |
| void | setAxes (QwtAxisId xAxis, QwtAxisId yAxis) |
| Set both axes. | |
| void | setXAxis (QwtAxisId) |
| Set the x-axis. | |
| QwtAxisId | xAxis () const |
| Get the x-axis. | |
| void | setYAxis (QwtAxisId) |
| Set the y-axis. | |
| QwtAxisId | yAxis () const |
| Get the y-axis. | |
| virtual void | itemChanged () |
| Notify the plot that the item has changed. | |
| virtual void | legendChanged () |
| Notify the item that the legend has changed. | |
| virtual void | updateLegend (const QwtPlotItem *, const QList< QwtLegendData > &) |
| Update the item with changes of the legend. | |
| QRectF | scaleRect (const QwtScaleMap &, const QwtScaleMap &) const |
| Calculate the scale rectangle. | |
| QRectF | paintRect (const QwtScaleMap &, const QwtScaleMap &) const |
| Calculate the paint rectangle. | |
| Public Member Functions inherited from QwtSeriesStore< QPointF > | |
| void | setData (QwtSeriesData< QPointF > *series) |
| QwtSeriesData< QPointF > * | data () |
| const QwtSeriesData< QPointF > * | data () const |
| QPointF | sample (size_t index) const |
| virtual size_t | dataSize () const override |
| virtual QRectF | dataRect () const override |
| virtual void | setRectOfInterest (const QRectF &rect) override |
| Set a the "rectangle of interest" for the stored series. | |
| QwtSeriesData< QPointF > * | swapData (QwtSeriesData< QPointF > *series) |
Protected Member Functions | |
| virtual void | drawSample (QPainter *painter, const QwtScaleMap &xMap, const QwtScaleMap &yMap, const QRectF &canvasRect, const QwtInterval &boundingInterval, int index, const QPointF &sample) const |
| Draw a sample. | |
| virtual void | drawBar (QPainter *, int sampleIndex, const QPointF &sample, const QwtColumnRect &) const |
| Draw a bar. | |
| QwtColumnRect | columnRect (const QwtScaleMap &xMap, const QwtScaleMap &yMap, const QRectF &canvasRect, const QwtInterval &boundingInterval, const QPointF &sample) const |
| Get column rectangle. | |
| QList< QwtLegendData > | legendData () const override |
| Get legend data. | |
| QwtGraphic | legendIcon (int index, const QSizeF &) const override |
| Get legend icon. | |
| Protected Member Functions inherited from QwtPlotAbstractBarChart | |
| double | sampleWidth (const QwtScaleMap &map, double canvasSize, double boundingSize, double value) const |
| Calculate the width for a sample in paint device coordinates. | |
| Protected Member Functions inherited from QwtPlotSeriesItem | |
| virtual void | dataChanged () override |
| dataChanged() indicates, that the series has been changed. | |
| Protected Member Functions inherited from QwtPlotItem | |
| QwtGraphic | defaultIcon (const QBrush &, const QSizeF &) const |
| Create a default icon. | |
Detailed Description
QwtPlotBarChart displays a series of values as bars.
Each bar might be customized individually by implementing a specialSymbol(). Otherwise it is rendered using a default symbol.
Depending on its orientation() the bars are displayed horizontally or vertically. The bars cover the interval between the baseline() and the value.
By activating the LegendBarTitles mode each sample will have its own entry on the legend.
The most common use case of a bar chart is to display a list of y coordinates, where the x coordinate is simply the index in the list. But for other situations ( f.e. when values are related to dates ) it is also possible to set x coordinates explicitly.
Member Enumeration Documentation
◆ LegendMode
Legend modes.
The default setting is QwtPlotBarChart::LegendChartTitle.
- See also
- setLegendMode(), legendMode()
| Enumerator | |
|---|---|
| LegendChartTitle | One entry on the legend showing the default symbol and the title() of the chart
|
| LegendBarTitles | One entry for each value showing the individual symbol of the corresponding bar and the bar title.
|
Constructor & Destructor Documentation
◆ QwtPlotBarChart()
|
explicit |
Constructor.
- Parameters
-
[in] title Title of the chart
Constructor
- Parameters
-
[in] title Title of the chart
Destructor
Member Function Documentation
◆ attach()
|
overridevirtual |
Attach the bar chart to a plot.
If the brush has not been explicitly set by the user, the bar chart automatically receives a color from the plot's color cycle. The pen is set to a darker shade of the fill color unless user-set.
- Parameters
-
plot Plot to attach to (nullptr to detach)
Reimplemented from QwtPlotItem.
◆ barTitle()
|
virtual |
Return the title of a bar.
In LegendBarTitles mode the title is displayed on the legend entry corresponding to a bar. The default implementation is a dummy, that is intended to be overloaded.
- Parameters
-
[in] sampleIndex Index of the bar
- Returns
- An empty text
- See also
- LegendBarTitles
◆ boundingRect()
|
overridevirtual |
Get the bounding rectangle of all samples.
- Returns
- Bounding rectangle of all samples. For an empty series the rectangle is invalid.
Reimplemented from QwtPlotSeriesItem.
◆ brush()
| QBrush QwtPlotBarChart::brush | ( | ) | const |
Get the bar symbol brush.
- Returns
- Brush for filling the bar
◆ columnRect()
|
protected |
Get column rectangle.
Calculate the geometry of a bar in widget coordinates.
- Parameters
-
xMap x map yMap y map canvasRect Contents rect of the canvas boundingInterval Bounding interval of sample values sample Value of the sample
- Returns
- Geometry of the column
◆ drawBar()
|
protectedvirtual |
Draw a bar.
- Parameters
-
painter Painter sampleIndex Index of the sample represented by the bar sample Value of the sample rect Bounding rectangle of the bar
◆ drawSample()
|
protectedvirtual |
Draw a sample.
- Parameters
-
painter Painter xMap x map yMap y map canvasRect Contents rect of the canvas boundingInterval Bounding interval of sample values index Index of the sample sample Value of the sample
- See also
- drawSeries()
◆ drawSeries()
|
overridevirtual |
Draw an interval of the bar chart.
- Parameters
-
[in] painter Painter [in] xMap Maps x-values into pixel coordinates. [in] yMap Maps y-values into pixel coordinates. [in] canvasRect Contents rect of the canvas [in] from Index of the first point to be painted [in] to Index of the last point to be painted. If to < 0 the curve will be painted to its last point.
- See also
- drawSymbols()
Implements QwtPlotSeriesItem.
◆ frameStyle()
| QwtColumnSymbol::FrameStyle QwtPlotBarChart::frameStyle | ( | ) | const |
Get the bar symbol frame style.
- Returns
- Frame style for the bar
◆ legendData()
|
overrideprotectedvirtual |
Get legend data.
Return all information, that is needed to represent the item on the legend.
In case of LegendBarTitles an entry for each bar is returned, otherwise the chart is represented like any other plot item from its title() and the legendIcon().
- Returns
- Information, that is needed to represent the item on the legend
- See also
- title(), setLegendMode(), barTitle(), QwtLegend, QwtPlotLegendItem
Reimplemented from QwtPlotItem.
◆ legendIcon()
|
overrideprotectedvirtual |
Get legend icon.
- Returns
- Icon representing a bar or the chart on the legend
When the legendMode() is LegendBarTitles the icon shows the bar corresponding to index - otherwise the bar displays the default symbol.
- Parameters
-
index Index of the legend entry size Icon size
Reimplemented from QwtPlotItem.
◆ legendMode()
| QwtPlotBarChart::LegendMode QwtPlotBarChart::legendMode | ( | ) | const |
◆ pen()
| QPen QwtPlotBarChart::pen | ( | ) | const |
Get the bar symbol pen.
- Returns
- Pen for drawing the bar outline
◆ rtti()
|
overridevirtual |
Get the runtime type information.
Reimplemented from QwtPlotItem.
◆ setBrush()
| void QwtPlotBarChart::setBrush | ( | const QBrush & | b | ) |
Set the bar symbol brush.
- Parameters
-
[in] b Brush for filling the bar
◆ setFrameStyle()
| void QwtPlotBarChart::setFrameStyle | ( | QwtColumnSymbol::FrameStyle | f | ) |
Set the bar symbol frame style.
- Parameters
-
[in] f Frame style for the bar
◆ setLegendMode()
| void QwtPlotBarChart::setLegendMode | ( | LegendMode | mode | ) |
Set the mode that decides what to display on the legend.
In case of LegendBarTitles barTitle() needs to be overloaded to return individual titles for each bar.
- Parameters
-
[in] mode New mode
◆ setPen()
| void QwtPlotBarChart::setPen | ( | const QPen & | p | ) |
Set the bar symbol pen.
- Parameters
-
[in] p Pen for drawing the bar outline
◆ setSamples() [1/3]
| void QwtPlotBarChart::setSamples | ( | const QVector< double > & | samples | ) |
Initialize data with an array of doubles.
The indices in the array are taken as x coordinate, while the doubles are interpreted as y values.
- Parameters
-
[in] samples Vector of y coordinates
- Note
- QVector is implicitly shared.
◆ setSamples() [2/3]
| void QwtPlotBarChart::setSamples | ( | const QVector< QPointF > & | samples | ) |
Initialize data with an array of points.
- Parameters
-
[in] samples Vector of points
- Note
- QVector is implicitly shared.
- QPolygonF is derived from QVector<QPointF>.
◆ setSamples() [3/3]
| void QwtPlotBarChart::setSamples | ( | QwtSeriesData< QPointF > * | data | ) |
Assign a series of samples.
setSamples() is just a wrapper for setData() without any additional value - beside that it is easier to find for the developer.
- Parameters
-
[in] data Data
- Warning
- The item takes ownership of the data object, deleting it when its not used anymore.
◆ setSymbol()
| void QwtPlotBarChart::setSymbol | ( | QwtColumnSymbol * | symbol | ) |
Assign a symbol.
The bar chart will take the ownership of the symbol, hence the previously set symbol will be deleted by setting a new one. If symbol is nullptr no symbol will be drawn.
- Parameters
-
[in] symbol Symbol
- See also
- symbol()
◆ specialSymbol()
|
virtual |
Get a special symbol for a specific sample.
Needs to be overloaded to return a non default symbol for a specific sample.
- Parameters
-
[in] sampleIndex Index of the sample represented by the bar [in] sample Value of the sample
- Returns
- nullptr, indicating to use the default symbol
◆ symbol()
| const QwtColumnSymbol * QwtPlotBarChart::symbol | ( | ) | const |
Get the current symbol.
- Returns
- Current symbol or nullptr, when no symbol has been assigned.
- See also
- setSymbol()
The documentation for this class was generated from the following files:
- /home/runner/work/QWT/QWT/src/plot/qwt_plot_barchart.h
- /home/runner/work/QWT/QWT/src/plot/qwt_plot_barchart.cpp