A plot item, that represents a series of points. More...
#include <qwt_plot_curve.h>
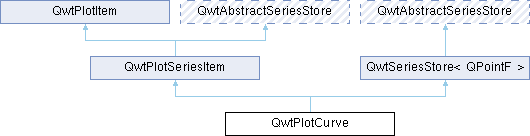
Classes | |
| class | PrivateData |
Public Member Functions | |
| QwtPlotCurve (const QString &title=QString()) | |
| QwtPlotCurve (const QwtText &title) | |
| Constructor with QwtText title. | |
| virtual int | rtti () const override |
| Get the runtime type information. | |
| void | attach (QwtPlot *plot) override |
| Attach the curve to a plot. | |
| void | setPaintAttribute (PaintAttribute, bool on=true) |
| Set paint attribute. | |
| bool | testPaintAttribute (PaintAttribute) const |
| Test paint attribute. | |
| void | setLegendAttribute (LegendAttribute, bool on=true) |
| Set legend attribute. | |
| bool | testLegendAttribute (LegendAttribute) const |
| Test legend attribute. | |
| void | setLegendAttributes (LegendAttributes) |
| Set legend attributes. | |
| LegendAttributes | legendAttributes () const |
| Get legend attributes. | |
| void | setRawSamples (const double *xData, const double *yData, int size) |
| Initialize data by pointing to memory blocks not managed by QwtPlotCurve (double) | |
| void | setRawSamples (const float *xData, const float *yData, int size) |
| Initialize data by pointing to memory blocks not managed by QwtPlotCurve (float) | |
| void | setRawSamples (const double *yData, int size) |
| Initialize data by pointing to a memory block not managed by QwtPlotCurve (double, y-axis only) | |
| void | setRawSamples (const float *yData, int size) |
| Initialize data by pointing to a memory block not managed by QwtPlotCurve (float, y-axis only) | |
| void | setSamples (const double *xData, const double *yData, int size) |
| Set data by copying x- and y-values from specified memory blocks (double) | |
| void | setSamples (const float *xData, const float *yData, int size) |
| Set data by copying x- and y-values from specified memory blocks (float) | |
| void | setSamples (const double *yData, int size) |
| Set data by copying y-values from a specified memory block (double) | |
| void | setSamples (const float *yData, int size) |
| Set data by copying y-values from a specified memory block (float) | |
| void | setSamples (const QVector< double > &yData) |
| Initialize data with an array of y values (explicitly shared, double) | |
| void | setSamples (const QVector< float > &yData) |
| Initialize data with an array of y values (explicitly shared, float) | |
| void | setSamples (const QVector< double > &xData, const QVector< double > &yData) |
| Initialize data with x- and y-arrays (explicitly shared, double) | |
| void | setSamples (const QVector< float > &xData, const QVector< float > &yData) |
| Initialize data with x- and y-arrays (explicitly shared, float) | |
| void | setSamples (QVector< double > &&xData, QVector< double > &&yData) |
| Initialize data with x- and y-arrays (rvalue, double) | |
| void | setSamples (QVector< float > &&xData, QVector< float > &&yData) |
| Initialize data with x- and y-arrays (rvalue, float) | |
| void | setSamples (QVector< QPointF > &&) |
| Initialize data with an array of points (rvalue) | |
| void | setSamples (const QVector< QPointF > &) |
| Initialize data with an array of points. | |
| void | setSamples (QwtSeriesData< QPointF > *) |
| Assign a series of points. | |
| virtual int | closestPoint (const QPointF &pos, double *dist=nullptr) const |
| Find the closest curve point for a specific position. | |
| double | minXValue () const |
| boundingRect().left() | |
| double | maxXValue () const |
| boundingRect().right() | |
| double | minYValue () const |
| boundingRect().top() | |
| double | maxYValue () const |
| boundingRect().bottom() | |
| void | setCurveAttribute (CurveAttribute, bool on=true) |
| Set curve attribute. | |
| bool | testCurveAttribute (CurveAttribute) const |
| Test curve attribute. | |
| void | setPen (const QColor &, qreal width=0.0, Qt::PenStyle=Qt::SolidLine) |
| Build and assign a pen. | |
| void | setPen (const QPen &) |
| Assign a pen. | |
| const QPen & | pen () const |
| Get the pen used to draw the lines. | |
| void | setBrush (const QBrush &) |
| Assign a brush. | |
| const QBrush & | brush () const |
| Get the brush used to fill the area between lines and the baseline. | |
| void | setBaseline (double) |
| Set the value of the baseline. | |
| double | baseline () const |
| Get the baseline value. | |
| void | setStyle (CurveStyle style) |
| Set the curve's drawing style. | |
| CurveStyle | style () const |
| Get the curve's drawing style. | |
| void | setSymbol (QwtSymbol *) |
| Assign a symbol. | |
| const QwtSymbol * | symbol () const |
| Get the current symbol. | |
| void | setCurveFitter (QwtCurveFitter *) |
| Assign a curve fitter. | |
| QwtCurveFitter * | curveFitter () const |
| Get the curve fitter. | |
| virtual void | drawSeries (QPainter *, const QwtScaleMap &xMap, const QwtScaleMap &yMap, const QRectF &canvasRect, int from, int to) const override |
| Draw an interval of the curve. | |
| virtual QwtGraphic | legendIcon (int index, const QSizeF &) const override |
| Get the icon representing the curve on the legend. | |
 Public Member Functions inherited from QwtPlotSeriesItem Public Member Functions inherited from QwtPlotSeriesItem | |
| QwtPlotSeriesItem (const QString &title=QString()) | |
| QwtPlotSeriesItem (const QwtText &title) | |
| Constructor. | |
| void | setOrientation (Qt::Orientation) |
| Set the orientation of the item. | |
| Qt::Orientation | orientation () const |
| Get the orientation of the plot item. | |
| virtual void | draw (QPainter *, const QwtScaleMap &xMap, const QwtScaleMap &yMap, const QRectF &canvasRect) const override |
| Draw the complete series. | |
| virtual QRectF | boundingRect () const override |
| Get the bounding rectangle. | |
| virtual void | updateScaleDiv (const QwtScaleDiv &, const QwtScaleDiv &) override |
| Update the scale divisions. | |
| Public Member Functions inherited from QwtPlotItem | |
| QwtPlotItem () | |
| Default constructor. | |
| QwtPlotItem (const QString &title) | |
| Constructor with title as QString. | |
| QwtPlotItem (const QwtText &title) | |
| Constructor with title as QwtText. | |
| virtual | ~QwtPlotItem () |
| Destructor. | |
| void | detach () |
| Detach the item from the plot. | |
| QwtPlot * | plot () const |
| Get the plot the item is attached to. | |
| void | setTitle (const QString &title) |
| Set the title using a QString. | |
| void | setTitle (const QwtText &title) |
| Set the title using a QwtText. | |
| const QwtText & | title () const |
| Get the title. | |
| void | setItemAttribute (ItemAttribute, bool on=true) |
| Set an item attribute. | |
| bool | testItemAttribute (ItemAttribute) const |
| Test an item attribute. | |
| void | setItemInterest (ItemInterest, bool on=true) |
| Set an item interest. | |
| bool | testItemInterest (ItemInterest) const |
| Test an item interest. | |
| void | setRenderHint (RenderHint, bool on=true) |
| Set a render hint. | |
| bool | testRenderHint (RenderHint) const |
| Test a render hint. | |
| void | setRenderThreadCount (uint numThreads) |
| Set the number of render threads. | |
| uint | renderThreadCount () const |
| Get the number of render threads. | |
| void | setLegendIconSize (const QSize &) |
| Set the legend icon size. | |
| QSize | legendIconSize () const |
| Get the legend icon size. | |
| double | z () const |
| Get the z-value. | |
| void | setZ (double z) |
| Set the z-value. | |
| void | show () |
| Show the item. | |
| void | hide () |
| Hide the item. | |
| virtual void | setVisible (bool) |
| Set the visibility. | |
| bool | isVisible () const |
| Check if the item is visible. | |
| void | setAxes (QwtAxisId xAxis, QwtAxisId yAxis) |
| Set both axes. | |
| void | setXAxis (QwtAxisId) |
| Set the x-axis. | |
| QwtAxisId | xAxis () const |
| Get the x-axis. | |
| void | setYAxis (QwtAxisId) |
| Set the y-axis. | |
| QwtAxisId | yAxis () const |
| Get the y-axis. | |
| virtual void | itemChanged () |
| Notify the plot that the item has changed. | |
| virtual void | legendChanged () |
| Notify the item that the legend has changed. | |
| virtual void | getCanvasMarginHint (const QwtScaleMap &xMap, const QwtScaleMap &yMap, const QRectF &canvasRect, double &left, double &top, double &right, double &bottom) const |
| Get margin hints for the canvas. | |
| virtual void | updateLegend (const QwtPlotItem *, const QList< QwtLegendData > &) |
| Update the item with changes of the legend. | |
| QRectF | scaleRect (const QwtScaleMap &, const QwtScaleMap &) const |
| Calculate the scale rectangle. | |
| QRectF | paintRect (const QwtScaleMap &, const QwtScaleMap &) const |
| Calculate the paint rectangle. | |
| virtual QList< QwtLegendData > | legendData () const |
| Return legend data. | |
| Public Member Functions inherited from QwtSeriesStore< QPointF > | |
| void | setData (QwtSeriesData< QPointF > *series) |
| QwtSeriesData< QPointF > * | data () |
| const QwtSeriesData< QPointF > * | data () const |
| QPointF | sample (size_t index) const |
| virtual size_t | dataSize () const override |
| virtual QRectF | dataRect () const override |
| virtual void | setRectOfInterest (const QRectF &rect) override |
| Set a the "rectangle of interest" for the stored series. | |
| QwtSeriesData< QPointF > * | swapData (QwtSeriesData< QPointF > *series) |
Protected Member Functions | |
| void | init () |
| Initialize the curve. | |
| virtual void | drawCurve (QPainter *, int style, const QwtScaleMap &xMap, const QwtScaleMap &yMap, const QRectF &canvasRect, int from, int to) const |
| Draw the curve. | |
| virtual void | drawSymbols (QPainter *, const QwtSymbol &, const QwtScaleMap &xMap, const QwtScaleMap &yMap, const QRectF &canvasRect, int from, int to) const |
| Draw symbols. | |
| virtual void | drawLines (QPainter *, const QwtScaleMap &xMap, const QwtScaleMap &yMap, const QRectF &canvasRect, int from, int to) const |
| Draw lines. | |
| virtual void | drawSticks (QPainter *, const QwtScaleMap &xMap, const QwtScaleMap &yMap, const QRectF &canvasRect, int from, int to) const |
| Draw sticks. | |
| virtual void | drawDots (QPainter *, const QwtScaleMap &xMap, const QwtScaleMap &yMap, const QRectF &canvasRect, int from, int to) const |
| Draw dots. | |
| virtual void | drawSteps (QPainter *, const QwtScaleMap &xMap, const QwtScaleMap &yMap, const QRectF &canvasRect, int from, int to) const |
| Draw steps. | |
| virtual void | fillCurve (QPainter *, const QwtScaleMap &, const QwtScaleMap &, const QRectF &canvasRect, QPolygonF &) const |
| Fill the curve. | |
| void | closePolyline (QPainter *, const QwtScaleMap &, const QwtScaleMap &, QPolygonF &) const |
| Close the polyline. | |
| Protected Member Functions inherited from QwtPlotSeriesItem | |
| virtual void | dataChanged () override |
| dataChanged() indicates, that the series has been changed. | |
| Protected Member Functions inherited from QwtPlotItem | |
| QwtGraphic | defaultIcon (const QBrush &, const QSizeF &) const |
| Create a default icon. | |
Detailed Description
A plot item, that represents a series of points.
A curve is the representation of a series of points in the x-y plane. It supports different display styles, interpolation ( f.e. spline ) and symbols.
- Usage
- a) Assign curve properties
- When a curve is created, it is configured to draw black solid lines with in QwtPlotCurve::Lines style and no symbols. You can change this by calling setPen(), setStyle() and setSymbol().
- b) Connect/Assign data.
- QwtPlotCurve gets its points using a QwtSeriesData object offering a bridge to the real storage of the points ( like QAbstractItemModel ). There are several convenience classes derived from QwtSeriesData, that also store the points inside ( like QStandardItemModel ). QwtPlotCurve also offers a couple of variations of setSamples(), that build QwtSeriesData objects from arrays internally.
- c) Attach the curve to a plot
- See QwtPlotItem::attach()
- Example:
- see examples/bode
- See also
- QwtPointSeriesData, QwtSymbol, QwtScaleMap
Member Enumeration Documentation
◆ CurveAttribute
Attribute for drawing the curve.
| Enumerator | |
|---|---|
| Inverted | For QwtPlotCurve::Steps only. Draws a step function from the right to the left. |
| Fitted | Only in combination with QwtPlotCurve::Lines A QwtCurveFitter tries to interpolate/smooth the curve, before it is painted.
|
◆ CurveStyle
Curve styles.
- See also
- setStyle(), style()
| Enumerator | |
|---|---|
| NoCurve | Don't draw a curve. Note: This doesn't affect the symbols. |
| Lines | Connect the points with straight lines. The lines might be interpolated depending on the 'Fitted' attribute. Curve fitting can be configured using setCurveFitter(). |
| Sticks | Draw vertical or horizontal sticks ( depending on the orientation() ) from a baseline which is defined by setBaseline(). |
| Steps | Connect the points with a step function. The step function is drawn from the left to the right or vice versa, depending on the QwtPlotCurve::Inverted attribute. |
| Dots | Draw dots at the locations of the data points. Note: This is different from a dotted line (see setPen()), and faster as a curve in QwtPlotCurve::NoStyle style and a symbol painting a point. |
| UserCurve | Styles >= QwtPlotCurve::UserCurve are reserved for derived classes of QwtPlotCurve that overload drawCurve() with additional application specific curve types. |
◆ LegendAttribute
Attributes how to represent the curve on the legend.
| Enumerator | |
|---|---|
| LegendNoAttribute | QwtPlotCurve tries to find a color representing the curve and paints a rectangle with it. |
| LegendShowLine | If the style() is not QwtPlotCurve::NoCurve a line is painted with the curve pen(). |
| LegendShowSymbol | If the curve has a valid symbol it is painted. |
| LegendShowBrush | If the curve has a brush a rectangle filled with the curve brush() is painted. |
◆ PaintAttribute
Attributes to modify the drawing algorithm.
The default setting enables ClipPolygons | FilterPointsLTTB
- See also
- setPaintAttribute(), testPaintAttribute()
| Enumerator | |
|---|---|
| ClipPolygons | Clip polygons before painting them. In situations, where points are far outside the visible area (f.e when zooming deep) this might be a substantial improvement for the painting performance |
| FilterPoints | Tries to reduce the data that has to be painted, by sorting out duplicates, or paintings outside the visible area. Might have a notable impact on curves with many close points. Only a couple of very basic filtering algorithms are implemented. |
| MinimizeMemory | Minimize memory usage that is temporarily needed for the translated points, before they get painted. This might slow down the performance of painting |
| ImageBuffer | Render the points to a temporary image and paint the image. This is a very special optimization for Dots style, when having a huge amount of points. With a reasonable number of points QPainter::drawPoints() will be faster. |
| FilterPointsAggressive | More aggressive point filtering trying to filter out intermediate points, accepting minor visual differences. Has only an effect, when drawing the curve to a paint device in integer coordinates ( f.e. all widgets on screen ) using the fact, that consecutive points are often mapped to the same x or y coordinate. Each chunk of samples mapped to the same coordinate can be reduced to 4 points ( first, min, max last ). In the worst case the polygon to be rendered will be 4 times the width of the plot canvas. The algorithm is very fast and effective for huge datasets, and can be used inside a replot cycle.
|
| FilterPointsPixel | Pixel-column based downsampling for extreme performance. Allocates a bin array indexed by pixel column and stores first/min/max/last Y per column. Each column produces at most 4 points. Combined with binary-search visible range for monotonic X data. Output size: ~4 * canvasWidth points regardless of input size. This is the fastest algorithm for datasets exceeding 100k points.
|
| FilterPointsLTTB | MinMax bucket downsampling (simplified LTTB variant). Divides the visible data range into N equal-count buckets and keeps the min-Y and max-Y point from each bucket. N is auto-calculated as 2 * canvasWidth. Output size: ~2 * N points. O(n) time complexity. Preserves visual shape better than FilterPointsPixel for data with uneven X distribution.
|
Constructor & Destructor Documentation
◆ QwtPlotCurve()
|
explicit |
Constructor with QwtText title.
- Parameters
-
[in] title Title of the curve
Constructor with QString title
- Parameters
-
[in] title Title of the curve
Destructor
Member Function Documentation
◆ attach()
|
overridevirtual |
Attach the curve to a plot.
If the pen has not been explicitly set by the user via setPen(), the curve automatically receives a color from the plot's color cycle. If an uncustomized symbol (default brush/pen) has been assigned, it is auto-colored to match the curve pen as well.
- Parameters
-
plot Plot to attach to (nullptr to detach)
Reimplemented from QwtPlotItem.
◆ baseline()
| double QwtPlotCurve::baseline | ( | ) | const |
◆ brush()
| const QBrush & QwtPlotCurve::brush | ( | ) | const |
Get the brush used to fill the area between lines and the baseline.
- Returns
- Brush used to fill the area between lines and the baseline
- See also
- setBrush(), setBaseline(), baseline()
◆ closePolyline()
|
protected |
Close the polyline.
Complete a polygon to be a closed polygon including the area between the original polygon and the baseline.
- Parameters
-
[in] painter Painter [in] xMap X map [in] yMap Y map [in,out] polygon Polygon to be completed
◆ closestPoint()
|
virtual |
Find the closest curve point for a specific position.
- Parameters
-
[in] pos Position where to look for the closest curve point [out] dist If dist != nullptr, returns the distance between the position and the closest curve point
- Returns
- Index of the closest curve point, or -1 if none can be found (e.g. when the curve has no points)
- Note
- closestPoint() implements a dumb algorithm that iterates over all points
◆ curveFitter()
| QwtCurveFitter * QwtPlotCurve::curveFitter | ( | ) | const |
Get the curve fitter.
- Returns
- Curve fitter, or nullptr if curve fitting is disabled
- See also
- setCurveFitter(), Fitted
◆ drawCurve()
|
protectedvirtual |
Draw the curve.
Draw the line part (without symbols) of a curve interval.
- Parameters
-
[in] painter Painter [in] style Curve style, see QwtPlotCurve::CurveStyle [in] xMap X map [in] yMap Y map [in] canvasRect Contents rectangle of the canvas [in] from Index of the first point to be painted [in] to Index of the last point to be painted
- See also
- draw(), drawDots(), drawLines(), drawSteps(), drawSticks()
◆ drawDots()
|
protectedvirtual |
Draw dots.
- Parameters
-
[in] painter Painter [in] xMap X map [in] yMap Y map [in] canvasRect Contents rectangle of the canvas [in] from Index of the first point to be painted [in] to Index of the last point to be painted
- See also
- draw(), drawCurve(), drawSticks(), drawLines(), drawSteps()
◆ drawLines()
|
protectedvirtual |
Draw lines.
If the CurveAttribute Fitted is enabled a QwtCurveFitter tries to interpolate/smooth the curve, before it is painted.
- Parameters
-
[in] painter Painter [in] xMap X map [in] yMap Y map [in] canvasRect Contents rectangle of the canvas [in] from Index of the first point to be painted [in] to Index of the last point to be painted
◆ drawSeries()
|
overridevirtual |
Draw an interval of the curve.
- Parameters
-
[in] painter Painter [in] xMap Maps x-values into pixel coordinates [in] yMap Maps y-values into pixel coordinates [in] canvasRect Contents rectangle of the canvas [in] from Index of the first point to be painted [in] to Index of the last point to be painted. If to < 0 the curve will be painted to its last point.
- See also
- drawCurve(), drawSymbols()
Implements QwtPlotSeriesItem.
◆ drawSteps()
|
protectedvirtual |
Draw steps.
Draw step function.
The direction of the steps depends on Inverted attribute.
- Parameters
-
[in] painter Painter [in] xMap X map [in] yMap Y map [in] canvasRect Contents rectangle of the canvas [in] from Index of the first point to be painted [in] to Index of the last point to be painted
◆ drawSticks()
|
protectedvirtual |
Draw sticks.
- Parameters
-
[in] painter Painter [in] xMap X map [in] yMap Y map [in] canvasRect Contents rectangle of the canvas [in] from Index of the first point to be painted [in] to Index of the last point to be painted
- See also
- draw(), drawCurve(), drawDots(), drawLines(), drawSteps()
◆ drawSymbols()
|
protectedvirtual |
Draw symbols.
- Parameters
-
[in] painter Painter [in] symbol Curve symbol [in] xMap X map [in] yMap Y map [in] canvasRect Contents rectangle of the canvas [in] from Index of the first point to be painted [in] to Index of the last point to be painted
- See also
- setSymbol(), drawSeries(), drawCurve()
◆ fillCurve()
|
protectedvirtual |
Fill the curve.
Fill the area between the curve and the baseline with the curve brush.
- Parameters
-
[in] painter Painter [in] xMap X map [in] yMap Y map [in] canvasRect Contents rectangle of the canvas [in,out] polygon Polygon - will be modified
- See also
- setBrush(), setBaseline(), setStyle()
◆ init()
|
protected |
Initialize the curve.
Initialize internal members.
Sets default attributes and creates internal data structures.
◆ legendAttributes()
| QwtPlotCurve::LegendAttributes QwtPlotCurve::legendAttributes | ( | ) | const |
Get legend attributes.
- Returns
- Attributes for drawing the legend icon
◆ legendIcon()
|
overridevirtual |
Get the icon representing the curve on the legend.
- Parameters
-
[in] index Index of the legend entry (ignored as there is only one) [in] size Icon size
- Returns
- Icon representing the curve on the legend
Reimplemented from QwtPlotItem.
◆ pen()
| const QPen & QwtPlotCurve::pen | ( | ) | const |
◆ rtti()
|
overridevirtual |
Get the runtime type information.
- Returns
- QwtPlotItem::Rtti_PlotCurve
Reimplemented from QwtPlotItem.
◆ setBaseline()
| void QwtPlotCurve::setBaseline | ( | double | value | ) |
Set the value of the baseline.
The baseline is needed for filling the curve with a brush or the Sticks drawing style. The interpretation of the baseline depends on the orientation(). With Qt::Vertical, the baseline is interpreted as a horizontal line at y = baseline(), with Qt::Horizontal, it is interpreted as a vertical line at x = baseline(). The default value is 0.0.
- Parameters
-
[in] value Value of the baseline
- See also
- baseline(), setBrush(), setStyle(), QwtPlotAbstractSeriesItem::orientation()
◆ setBrush()
| void QwtPlotCurve::setBrush | ( | const QBrush & | brush | ) |
Assign a brush.
In case of brush.style() != QBrush::NoBrush and style() != QwtPlotCurve::Sticks, the area between the curve and the baseline will be filled. In case !brush.color().isValid() the area will be filled by pen.color(). The fill algorithm simply connects the first and the last curve point to the baseline. So the curve data has to be sorted (ascending or descending).
- Parameters
-
[in] brush New brush
- See also
- brush(), setBaseline(), baseline()
◆ setCurveAttribute()
| void QwtPlotCurve::setCurveAttribute | ( | CurveAttribute | attribute, |
| bool | on = true |
||
| ) |
Set curve attribute.
- Parameters
-
[in] attribute Curve attribute [in] on On/Off
- See also
- testCurveAttribute(), setCurveFitter()
◆ setCurveFitter()
| void QwtPlotCurve::setCurveFitter | ( | QwtCurveFitter * | curveFitter | ) |
Assign a curve fitter.
The curve fitter "smooths" the curve points, when the Fitted CurveAttribute is set. setCurveFitter(nullptr) also disables curve fitting. The curve fitter operates on the translated points (= widget coordinates) to be functional for logarithmic scales. Obviously this is less performant for fitting algorithms, that reduce the number of points. For situations, where curve fitting is used to improve the performance of painting huge series of points it might be better to execute the fitter on the curve points once and to cache the result in the QwtSeriesData object.
- Parameters
-
[in] curveFitter Curve fitter
- See also
- Fitted
◆ setLegendAttribute()
| void QwtPlotCurve::setLegendAttribute | ( | LegendAttribute | attribute, |
| bool | on = true |
||
| ) |
Set legend attribute.
- Parameters
-
[in] attribute Legend attribute [in] on On/Off
- See also
- testLegendAttribute(), legendIcon()
◆ setLegendAttributes()
| void QwtPlotCurve::setLegendAttributes | ( | LegendAttributes | attributes | ) |
Set legend attributes.
- Parameters
-
[in] attributes Legend attributes
- See also
- setLegendAttribute(), legendIcon()
◆ setPaintAttribute()
| void QwtPlotCurve::setPaintAttribute | ( | PaintAttribute | attribute, |
| bool | on = true |
||
| ) |
Set paint attribute.
- Parameters
-
[in] attribute Paint attribute [in] on On/Off
- See also
- testPaintAttribute()
◆ setPen() [1/2]
| void QwtPlotCurve::setPen | ( | const QColor & | color, |
| qreal | width = 0.0, |
||
| Qt::PenStyle | style = Qt::SolidLine |
||
| ) |
◆ setPen() [2/2]
| void QwtPlotCurve::setPen | ( | const QPen & | pen | ) |
◆ setRawSamples() [1/4]
| void QwtPlotCurve::setRawSamples | ( | const double * | xData, |
| const double * | yData, | ||
| int | size | ||
| ) |
Initialize data by pointing to memory blocks not managed by QwtPlotCurve (double)
setRawSamples is provided for efficiency. It is important to keep the pointers during the lifetime of the underlying QwtCPointerData class.
- Parameters
-
[in] xData Pointer to x data [in] yData Pointer to y data [in] size Size of x and y
- See also
- QwtCPointerData
◆ setRawSamples() [2/4]
| void QwtPlotCurve::setRawSamples | ( | const double * | yData, |
| int | size | ||
| ) |
Initialize data by pointing to a memory block not managed by QwtPlotCurve (double, y-axis only)
The memory contains the y coordinates, while the index is interpreted as x coordinate. setRawSamples() is provided for efficiency. It is important to keep the pointers during the lifetime of the underlying QwtCPointerValueData class.
- Parameters
-
[in] yData Pointer to y data [in] size Size of y data
- See also
- QwtCPointerData
◆ setRawSamples() [3/4]
| void QwtPlotCurve::setRawSamples | ( | const float * | xData, |
| const float * | yData, | ||
| int | size | ||
| ) |
Initialize data by pointing to memory blocks not managed by QwtPlotCurve (float)
setRawSamples is provided for efficiency. It is important to keep the pointers during the lifetime of the underlying QwtCPointerData class.
- Parameters
-
[in] xData Pointer to x data [in] yData Pointer to y data [in] size Size of x and y
- See also
- QwtCPointerData
◆ setRawSamples() [4/4]
| void QwtPlotCurve::setRawSamples | ( | const float * | yData, |
| int | size | ||
| ) |
Initialize data by pointing to a memory block not managed by QwtPlotCurve (float, y-axis only)
The memory contains the y coordinates, while the index is interpreted as x coordinate. setRawSamples() is provided for efficiency. It is important to keep the pointers during the lifetime of the underlying QwtCPointerValueData class.
- Parameters
-
[in] yData Pointer to y data [in] size Size of y data
- See also
- QwtCPointerData
◆ setSamples() [1/13]
| void QwtPlotCurve::setSamples | ( | const double * | xData, |
| const double * | yData, | ||
| int | size | ||
| ) |
Set data by copying x- and y-values from specified memory blocks (double)
Contrary to setRawSamples(), this function makes a 'deep copy' of the data.
- Parameters
-
[in] xData Pointer to x values [in] yData Pointer to y values [in] size Size of xData and yData
- See also
- QwtPointArrayData
◆ setSamples() [2/13]
| void QwtPlotCurve::setSamples | ( | const double * | yData, |
| int | size | ||
| ) |
Set data by copying y-values from a specified memory block (double)
The memory contains the y coordinates, while the index is interpreted as x coordinate.
- Parameters
-
[in] yData Y data [in] size Size of yData
- See also
- QwtValuePointData
◆ setSamples() [3/13]
| void QwtPlotCurve::setSamples | ( | const float * | xData, |
| const float * | yData, | ||
| int | size | ||
| ) |
Set data by copying x- and y-values from specified memory blocks (float)
Contrary to setRawSamples(), this function makes a 'deep copy' of the data.
- Parameters
-
[in] xData Pointer to x values [in] yData Pointer to y values [in] size Size of xData and yData
- See also
- QwtPointArrayData
◆ setSamples() [4/13]
| void QwtPlotCurve::setSamples | ( | const float * | yData, |
| int | size | ||
| ) |
Set data by copying y-values from a specified memory block (float)
The vector contains the y coordinates, while the index is interpreted as x coordinate.
- Parameters
-
[in] yData Y data [in] size Size of yData
- See also
- QwtValuePointData
◆ setSamples() [5/13]
Initialize data with x- and y-arrays (explicitly shared, double)
- Parameters
-
[in] xData X data [in] yData Y data
- See also
- QwtPointArrayData
◆ setSamples() [6/13]
| void QwtPlotCurve::setSamples | ( | const QVector< double > & | yData | ) |
Initialize data with an array of y values (explicitly shared, double)
The vector contains the y coordinates, while the index is the x coordinate.
- Parameters
-
[in] yData Y data
- See also
- QwtValuePointData
◆ setSamples() [7/13]
Initialize data with x- and y-arrays (explicitly shared, float)
- Parameters
-
[in] xData X data [in] yData Y data
- See also
- QwtPointArrayData
◆ setSamples() [8/13]
| void QwtPlotCurve::setSamples | ( | const QVector< float > & | yData | ) |
Initialize data with an array of y values (explicitly shared, float)
The vector contains the y coordinates, while the index is the x coordinate.
- Parameters
-
[in] yData Y data
- See also
- QwtValuePointData
◆ setSamples() [9/13]
| void QwtPlotCurve::setSamples | ( | const QVector< QPointF > & | samples | ) |
Initialize data with an array of points.
- Parameters
-
[in] samples Vector of points
- Note
- QVector is implicitly shared
- QPolygonF is derived from QVector<QPointF>
◆ setSamples() [10/13]
Initialize data with x- and y-arrays (rvalue, double)
- Parameters
-
[in] xData X data [in] yData Y data
- See also
- QwtPointArrayData
◆ setSamples() [11/13]
Initialize data with x- and y-arrays (rvalue, float)
- Parameters
-
[in] xData X data [in] yData Y data
- See also
- QwtPointArrayData
◆ setSamples() [12/13]
| void QwtPlotCurve::setSamples | ( | QVector< QPointF > && | samples | ) |
Initialize data with an array of points (rvalue)
- Parameters
-
[in] samples Vector of points
- Note
- QVector is implicitly shared
- QPolygonF is derived from QVector<QPointF>
◆ setSamples() [13/13]
| void QwtPlotCurve::setSamples | ( | QwtSeriesData< QPointF > * | data | ) |
Assign a series of points.
setSamples() is just a wrapper for setData() without any additional value - beside that it is easier to find for the developer.
- Parameters
-
[in] data Data
- Warning
- The item takes ownership of the data object, deleting it when it's not used anymore.
◆ setStyle()
| void QwtPlotCurve::setStyle | ( | CurveStyle | style | ) |
◆ setSymbol()
| void QwtPlotCurve::setSymbol | ( | QwtSymbol * | symbol | ) |
Assign a symbol.
The curve will take the ownership of the symbol, hence the previously set symbol will be deleted by setting a new one. If symbol is nullptr no symbol will be drawn.
If the curve is already attached and the new symbol is in its default (uncustomized) state, it is auto-colored to match the curve pen, so that a scatter-style curve inherits the color cycle color of its pen.
- Parameters
-
[in] symbol Symbol
◆ style()
| QwtPlotCurve::CurveStyle QwtPlotCurve::style | ( | ) | const |
◆ symbol()
| const QwtSymbol * QwtPlotCurve::symbol | ( | ) | const |
Get the current symbol.
- Returns
- Current symbol or nullptr when no symbol has been assigned
- See also
- setSymbol()
◆ testCurveAttribute()
| bool QwtPlotCurve::testCurveAttribute | ( | CurveAttribute | attribute | ) | const |
Test curve attribute.
- Parameters
-
[in] attribute Curve attribute
- Returns
- True if attribute is enabled
- See also
- setCurveAttribute()
◆ testLegendAttribute()
| bool QwtPlotCurve::testLegendAttribute | ( | LegendAttribute | attribute | ) | const |
Test legend attribute.
- Parameters
-
[in] attribute Legend attribute
- Returns
- True when attribute is enabled
- See also
- setLegendAttribute()
◆ testPaintAttribute()
| bool QwtPlotCurve::testPaintAttribute | ( | PaintAttribute | attribute | ) | const |
Test paint attribute.
- Parameters
-
[in] attribute Paint attribute
- Returns
- True when attribute is enabled
- See also
- setPaintAttribute()
The documentation for this class was generated from the following files:
- /home/runner/work/QWT/QWT/src/plot/qwt_plot_curve.h
- /home/runner/work/QWT/QWT/src/plot/qwt_plot_curve.cpp