Curve that displays 3D points as dots, where the z coordinate is mapped to a color 更多...
#include <qwt_plot_spectrocurve.h>
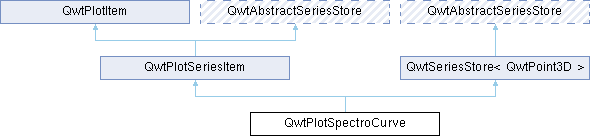
类 | |
| class | PrivateData |
Public 类型 | |
| enum | PaintAttribute { ClipPoints = 1 } |
| Paint attributes 更多... | |
 Public 类型 继承自 QwtPlotItem Public 类型 继承自 QwtPlotItem | |
| enum | RttiValues { Rtti_PlotItem = 0 , Rtti_PlotGrid , Rtti_PlotScale , Rtti_PlotLegend , Rtti_PlotMarker , Rtti_PlotCurve , Rtti_PlotSpectroCurve , Rtti_PlotIntervalCurve , Rtti_PlotHistogram , Rtti_PlotSpectrogram , Rtti_PlotGraphic , Rtti_PlotTradingCurve , Rtti_PlotBarChart , Rtti_PlotMultiBarChart , Rtti_PlotShape , Rtti_PlotTextLabel , Rtti_PlotZone , Rtti_PlotVectorField , Rtti_PlotArrowMarker , Rtti_PlotBoxChart , Rtti_PlotUserItem = 1000 } |
| Runtime type information 更多... | |
| enum | ItemAttribute { Legend = 0x01 , AutoScale = 0x02 , Margins = 0x04 } |
| Plot Item Attributes 更多... | |
| enum | ItemInterest { ScaleInterest = 0x01 , LegendInterest = 0x02 } |
| Plot Item Interests 更多... | |
| enum | RenderHint { RenderAntialiased = 0x1 } |
| Render hints 更多... | |
Public 成员函数 | |
| QwtPlotSpectroCurve (const QString &title=QString()) | |
| Constructor | |
| QwtPlotSpectroCurve (const QwtText &title) | |
| Constructor with title | |
| ~QwtPlotSpectroCurve () override | |
| Destructor | |
| virtual int | rtti () const override |
| Get the runtime type information | |
| void | setPaintAttribute (PaintAttribute, bool on=true) |
| Set a paint attribute | |
| bool | testPaintAttribute (PaintAttribute) const |
| Test a paint attribute | |
| void | setSamples (const QVector< QwtPoint3D > &) |
| Set the samples | |
| void | setSamples (QwtSeriesData< QwtPoint3D > *) |
| Set the samples | |
| void | setColorMap (QwtColorMap *) |
| Set the color map | |
| const QwtColorMap * | colorMap () const |
| Get the color map | |
| void | setColorRange (const QwtInterval &) |
| Set the color range | |
| const QwtInterval & | colorRange () const |
| Get the color range | |
| virtual void | drawSeries (QPainter *, const QwtScaleMap &xMap, const QwtScaleMap &yMap, const QRectF &canvasRect, int from, int to) const override |
| Draw the series | |
| void | setPenWidth (double) |
| Set the pen width | |
| double | penWidth () const |
| Get the pen width | |
| Public 成员函数 继承自 QwtPlotSeriesItem | |
| QwtPlotSeriesItem (const QString &title=QString()) | |
| QwtPlotSeriesItem (const QwtText &title) | |
| Constructor | |
| void | setOrientation (Qt::Orientation) |
| Set the orientation of the item | |
| Qt::Orientation | orientation () const |
| Get the orientation of the plot item | |
| virtual void | draw (QPainter *, const QwtScaleMap &xMap, const QwtScaleMap &yMap, const QRectF &canvasRect) const override |
| Draw the complete series | |
| virtual QRectF | boundingRect () const override |
| Get the bounding rectangle | |
| virtual void | updateScaleDiv (const QwtScaleDiv &, const QwtScaleDiv &) override |
| Update the scale divisions | |
| Public 成员函数 继承自 QwtPlotItem | |
| QwtPlotItem () | |
| Default constructor | |
| QwtPlotItem (const QString &title) | |
| Constructor with title as QString | |
| QwtPlotItem (const QwtText &title) | |
| Constructor with title as QwtText | |
| virtual | ~QwtPlotItem () |
| Destructor | |
| virtual void | attach (QwtPlot *plot) |
| Attach the item to a plot | |
| void | detach () |
| Detach the item from the plot | |
| QwtPlot * | plot () const |
| Get the plot the item is attached to | |
| void | setTitle (const QString &title) |
| Set the title using a QString | |
| void | setTitle (const QwtText &title) |
| Set the title using a QwtText | |
| const QwtText & | title () const |
| Get the title | |
| void | setItemAttribute (ItemAttribute, bool on=true) |
| Set an item attribute | |
| bool | testItemAttribute (ItemAttribute) const |
| Test an item attribute | |
| void | setItemInterest (ItemInterest, bool on=true) |
| Set an item interest | |
| bool | testItemInterest (ItemInterest) const |
| Test an item interest | |
| void | setRenderHint (RenderHint, bool on=true) |
| Set a render hint | |
| bool | testRenderHint (RenderHint) const |
| Test a render hint | |
| void | setRenderThreadCount (uint numThreads) |
| Set the number of render threads | |
| uint | renderThreadCount () const |
| Get the number of render threads | |
| void | setLegendIconSize (const QSize &) |
| Set the legend icon size | |
| QSize | legendIconSize () const |
| Get the legend icon size | |
| double | z () const |
| Get the z-value | |
| void | setZ (double z) |
| Set the z-value | |
| void | show () |
| Show the item | |
| void | hide () |
| Hide the item | |
| virtual void | setVisible (bool) |
| Set the visibility | |
| bool | isVisible () const |
| Check if the item is visible | |
| void | setAxes (QwtAxisId xAxis, QwtAxisId yAxis) |
| Set both axes | |
| void | setXAxis (QwtAxisId) |
| Set the x-axis | |
| QwtAxisId | xAxis () const |
| Get the x-axis | |
| void | setYAxis (QwtAxisId) |
| Set the y-axis | |
| QwtAxisId | yAxis () const |
| Get the y-axis | |
| virtual void | itemChanged () |
| Notify the plot that the item has changed | |
| virtual void | legendChanged () |
| Notify the item that the legend has changed | |
| virtual void | getCanvasMarginHint (const QwtScaleMap &xMap, const QwtScaleMap &yMap, const QRectF &canvasRect, double &left, double &top, double &right, double &bottom) const |
| Get margin hints for the canvas | |
| virtual void | updateLegend (const QwtPlotItem *, const QList< QwtLegendData > &) |
| Update the item with changes of the legend | |
| QRectF | scaleRect (const QwtScaleMap &, const QwtScaleMap &) const |
| Calculate the scale rectangle | |
| QRectF | paintRect (const QwtScaleMap &, const QwtScaleMap &) const |
| Calculate the paint rectangle | |
| virtual QList< QwtLegendData > | legendData () const |
| Return legend data | |
| virtual QwtGraphic | legendIcon (int index, const QSizeF &) const |
| Return a legend icon | |
| Public 成员函数 继承自 QwtSeriesStore< QwtPoint3D > | |
| void | setData (QwtSeriesData< QwtPoint3D > *series) |
| QwtSeriesData< QwtPoint3D > * | data () |
| const QwtSeriesData< QwtPoint3D > * | data () const |
| QwtPoint3D | sample (size_t index) const |
| virtual size_t | dataSize () const override |
| virtual QRectF | dataRect () const override |
| virtual void | setRectOfInterest (const QRectF &rect) override |
| Set a the "rectangle of interest" for the stored series | |
| QwtSeriesData< QwtPoint3D > * | swapData (QwtSeriesData< QwtPoint3D > *series) |
Protected 成员函数 | |
| virtual void | drawDots (QPainter *, const QwtScaleMap &xMap, const QwtScaleMap &yMap, const QRectF &canvasRect, int from, int to) const |
| Draw the dots | |
| Protected 成员函数 继承自 QwtPlotSeriesItem | |
| virtual void | dataChanged () override |
| dataChanged() indicates, that the series has been changed. | |
| Protected 成员函数 继承自 QwtPlotItem | |
| QwtGraphic | defaultIcon (const QBrush &, const QSizeF &) const |
| Create a default icon | |
详细描述
Curve that displays 3D points as dots, where the z coordinate is mapped to a color
QwtPlotSpectroCurve displays 3D points as dots, with the z coordinate mapped to a color using a color map.
成员枚举类型说明
◆ PaintAttribute
构造及析构函数说明
◆ QwtPlotSpectroCurve()
|
explicit |
Constructor with title
Constructor
- 参数
-
[in] title Title of the curve
Constructor
- 参数
-
[in] title Title of the curve
Destructor
成员函数说明
◆ colorMap()
| const QwtColorMap * QwtPlotSpectroCurve::colorMap | ( | ) | const |
Get the color map
Get the color map used for mapping intensity values to colors
- 返回
- Color map used for mapping the intensity values to colors
- 参见
- setColorMap(), setColorRange(), QwtColorMap::color()
◆ colorRange()
| const QwtInterval & QwtPlotSpectroCurve::colorRange | ( | ) | const |
Get the color range
Get the value interval that corresponds to the color map
- 返回
- Value interval that corresponds to the color map
- 参见
- setColorRange(), setColorMap(), QwtColorMap::color()
◆ drawDots()
|
protectedvirtual |
Draw the dots
Draw a subset of the points
- 参数
-
painter Painter xMap Maps x-values into pixel coordinates. yMap Maps y-values into pixel coordinates. canvasRect Contents rectangle of the canvas from Index of the first sample to be painted to Index of the last sample to be painted. If to < 0 the series will be painted to its last sample.
◆ drawSeries()
|
overridevirtual |
Draw the series
Draw a subset of the points
- 参数
-
[in] painter Painter [in] xMap Maps x-values into pixel coordinates [in] yMap Maps y-values into pixel coordinates [in] canvasRect Contents rectangle of the canvas [in] from Index of the first sample to be painted [in] to Index of the last sample to be painted. If to < 0, the series will be painted to its last sample.
实现了 QwtPlotSeriesItem.
◆ penWidth()
| double QwtPlotSpectroCurve::penWidth | ( | ) | const |
Get the pen width
Get the pen width used to draw a dot
- 返回
- Pen width used to draw a dot
◆ rtti()
|
overridevirtual |
◆ setColorMap()
| void QwtPlotSpectroCurve::setColorMap | ( | QwtColorMap * | colorMap | ) |
Set the color map
Change the color map
Often it is useful to display the mapping between intensities and colors as an additional plot axis, showing a color bar.
- 参数
-
[in] colorMap Color map
- 参见
- colorMap(), setColorRange(), QwtColorMap::color(), QwtScaleWidget::setColorBarEnabled(), QwtScaleWidget::setColorMap()
◆ setColorRange()
| void QwtPlotSpectroCurve::setColorRange | ( | const QwtInterval & | interval | ) |
Set the color range
Set the value interval that corresponds to the color map
- 参数
-
[in] interval interval.minValue() corresponds to 0.0, interval.maxValue() to 1.0 on the color map.
- 参见
- colorRange(), setColorMap(), QwtColorMap::color()
◆ setPaintAttribute()
| void QwtPlotSpectroCurve::setPaintAttribute | ( | PaintAttribute | attribute, |
| bool | on = true |
||
| ) |
Set a paint attribute
Specify an attribute how to draw the curve
- 参数
-
[in] attribute Paint attribute [in] on On/Off
◆ setPenWidth()
| void QwtPlotSpectroCurve::setPenWidth | ( | double | penWidth | ) |
◆ setSamples() [1/2]
| void QwtPlotSpectroCurve::setSamples | ( | const QVector< QwtPoint3D > & | samples | ) |
Set the samples
Initialize data with an array of samples
- 参数
-
[in] samples Vector of points
◆ setSamples() [2/2]
| void QwtPlotSpectroCurve::setSamples | ( | QwtSeriesData< QwtPoint3D > * | data | ) |
Set the samples
Assign a series of samples
setSamples() is just a wrapper for setData() without any additional value - beside that it is easier to find for the developer.
- 参数
-
[in] data Data
- 警告
- The item takes ownership of the data object, deleting it when its not used anymore.
◆ testPaintAttribute()
| bool QwtPlotSpectroCurve::testPaintAttribute | ( | PaintAttribute | attribute | ) | const |
Test a paint attribute
Test if a paint attribute is enabled
- 返回
- True when attribute is enabled
该类的文档由以下文件生成:
- /home/runner/work/QWT/QWT/src/plot/qwt_plot_spectrocurve.h
- /home/runner/work/QWT/QWT/src/plot/qwt_plot_spectrocurve.cpp