A 2-D plotting widget 更多...
#include <qwt_plot.h>
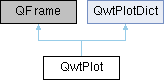
类 | |
| class | PrivateData |
| class | ScaleData |
Public 类型 | |
| enum | LegendPosition { LeftLegend , RightLegend , BottomLegend , TopLegend } |
| Position of the legend, relative to the canvas 更多... | |
| enum | TickDirection { TickOutside = 0 , TickInside = 1 } |
| Tick direction enum 更多... | |
| enum | Axis { yLeft = QwtAxis::YLeft , yRight = QwtAxis::YRight , xBottom = QwtAxis::XBottom , xTop = QwtAxis::XTop , axisCnt = QwtAxis::AxisPositions } |
Public 槽 | |
| virtual void | replot () |
| Redraw the plot | |
| void | autoRefresh () |
| Replots the plot if autoReplot() is enabled | |
| virtual void | replotAll () |
| Replot all plots | |
| void | autoRefreshAll () |
信号 | |
| void | itemAttached (QwtPlotItem *plotItem, bool on) |
| A signal indicating that an item has been attached/detached | |
| void | legendDataChanged (const QVariant &itemInfo, const QList< QwtLegendData > &data) |
| A signal with the attributes how to update the legend entries for a plot item. | |
| void | parasitePlotAttached (QwtPlot *parasitePlot, bool on) |
| Identify the relationship between the parasitic plot and its host plot | |
Public 成员函数 | |
| QwtPlot (QWidget *=nullptr) | |
| Constructor | |
| QwtPlot (const QwtText &title, QWidget *=nullptr) | |
| void | setAutoReplot (bool=true) |
| Set or reset the autoReplot option | |
| bool | autoReplot () const |
| Check if autoReplot option is enabled | |
| QString | plotId () const |
| Plot ID | |
| void | setPlotId (const QString &id) |
| void | setPlotLayout (QwtPlotLayout *) |
| Assign a new plot layout | |
| QwtPlotLayout * | plotLayout () |
| Get the plot's layout | |
| const QwtPlotLayout * | plotLayout () const |
| Get the plot's layout | |
| void | setTitle (const QString &) |
| Change the plot's title | |
| void | setTitle (const QwtText &) |
| Change the plot's title | |
| QwtText | title () const |
| Get the plot's title | |
| QwtTextLabel * | titleLabel () |
| Get the title label widget | |
| const QwtTextLabel * | titleLabel () const |
| Get the title label widget | |
| void | setFooter (const QString &) |
| Change the footer text | |
| void | setFooter (const QwtText &) |
| Change the footer text | |
| QwtText | footer () const |
| Get the footer text | |
| QwtTextLabel * | footerLabel () |
| Get the footer label widget | |
| const QwtTextLabel * | footerLabel () const |
| Get the footer label widget | |
| void | setCanvas (QWidget *) |
| Set the drawing canvas of the plot widget | |
| QWidget * | canvas () |
| Get the plot's canvas | |
| const QWidget * | canvas () const |
| Get the plot's canvas | |
| void | setCanvasBackground (const QBrush &) |
| Change the background of the plotting area | |
| QBrush | canvasBackground () const |
| Nothing else than: canvas()->palette().brush(
QPalette::Normal, QPalette::Window); | |
| void | setColorCycle (const QwtColorCycle &) |
| Set the color cycle used for automatic item coloring | |
| QwtColorCycle | colorCycle () const |
| Get the current color cycle | |
| QColor | nextColorForItem (int rtti) |
| Get the next auto-assigned color for a plot item type | |
| virtual QwtScaleMap | canvasMap (QwtAxisId) const |
| double | invTransform (QwtAxisId, double pos) const |
| Transform the x or y coordinate of a position in the drawing region into a value. | |
| double | transform (QwtAxisId, double value) const |
| Transform a value into a coordinate in the plotting region | |
| bool | isAxisValid (QwtAxisId) const |
| Checks if an axis is valid | |
| void | setAxisVisible (QwtAxisId, bool on=true) |
| Hide or show a specified axis | |
| bool | isAxisVisible (QwtAxisId) const |
| Return whether the specified axis is visible | |
| QwtScaleEngine * | axisScaleEngine (QwtAxisId) |
| Return the scale engine for a specific axis | |
| const QwtScaleEngine * | axisScaleEngine (QwtAxisId) const |
| Return the scale engine for a specific axis (const overload) | |
| void | setAxisScaleEngine (QwtAxisId, QwtScaleEngine *) |
| Change the scale engine for an axis | |
| void | setAxisAutoScale (QwtAxisId, bool on=true) |
| Enable autoscaling for a specified axis | |
| bool | axisAutoScale (QwtAxisId) const |
| Return whether autoscaling is enabled | |
| void | setAxisFont (QwtAxisId, const QFont &) |
| Change the font of an axis | |
| QFont | axisFont (QwtAxisId) const |
| Return the font of the scale labels for a specified axis | |
| void | setAxisScale (QwtAxisId, double min, double max, double stepSize=0) |
| Disable autoscaling and specify a fixed scale for a selected axis | |
| void | setAxisScaleDiv (QwtAxisId, const QwtScaleDiv &) |
| Disable autoscaling and specify a fixed scale for a selected axis. | |
| void | setAxisScaleDraw (QwtAxisId, QwtScaleDraw *) |
| Set a scale draw | |
| double | axisStepSize (QwtAxisId) const |
| Return the step size parameter that has been set in setAxisScale. | |
| QwtInterval | axisInterval (QwtAxisId) const |
| Return the current interval of the specified axis | |
| const QwtScaleDiv & | axisScaleDiv (QwtAxisId) const |
| Return the scale division of a specified axis | |
| const QwtScaleDraw * | axisScaleDraw (QwtAxisId) const |
| Return the scale draw of a specified axis | |
| QwtScaleDraw * | axisScaleDraw (QwtAxisId) |
| Return the scale draw of a specified axis | |
| const QwtScaleWidget * | axisWidget (QwtAxisId) const |
| Return the scale widget of the specified axis | |
| QwtScaleWidget * | axisWidget (QwtAxisId) |
| Return the scale widget of the specified axis | |
| QwtAxisId | visibleXAxisId () const |
| Return the currently visible X axis | |
| QwtAxisId | visibleYAxisId () const |
| Return the currently usable Y axis | |
| void | setAxisLabelAlignment (QwtAxisId, Qt::Alignment) |
| Change the alignment of the tick labels | |
| void | setAxisLabelRotation (QwtAxisId, double rotation) |
| Rotate all tick labels | |
| void | setAxisTitle (QwtAxisId, const QString &) |
| Change the title of a specified axis | |
| void | setAxisTitle (QwtAxisId, const QwtText &) |
| Change the title of a specified axis | |
| QwtText | axisTitle (QwtAxisId) const |
| Get the title of a specified axis | |
| void | setAxisTitlePosition (QwtAxisId, QwtScaleWidget::TitlePosition) |
| Set the position of an axis title along the backbone | |
| QwtScaleWidget::TitlePosition | axisTitlePosition (QwtAxisId) const |
| Get the position of an axis title along the backbone | |
| void | setAxisTitlePlacement (QwtAxisId, QwtScaleWidget::TitlePlacement) |
| Set the placement of an axis title (inside the scale widget or outside as caption) | |
| QwtScaleWidget::TitlePlacement | axisTitlePlacement (QwtAxisId) const |
| Get the placement of an axis title | |
| void | setAxisTitleAlignment (QwtAxisId, Qt::Alignment) |
| Set the horizontal alignment of an axis title | |
| Qt::Alignment | axisTitleAlignment (QwtAxisId) const |
| Get the horizontal alignment of an axis title | |
| void | setAxisMaxMinor (QwtAxisId, int maxMinor) |
| Set the maximum number of minor scale intervals for a specified axis | |
| int | axisMaxMinor (QwtAxisId) const |
| Return the maximum number of minor ticks for a specified axis | |
| void | setAxisMaxMajor (QwtAxisId, int maxMajor) |
| Set the maximum number of major scale intervals for a specified axis | |
| int | axisMaxMajor (QwtAxisId) const |
| Return the maximum number of major ticks for a specified axis | |
| void | setAxisTickDirection (QwtAxisId axisId, TickDirection direction) |
| Set the tick direction for an axis | |
| TickDirection | axisTickDirection (QwtAxisId axisId) const |
| Get the tick direction for an axis | |
| void | insertLegend (QwtAbstractLegend *, LegendPosition=QwtPlot::RightLegend, double ratio=-1.0) |
| Insert a legend | |
| QwtAbstractLegend * | legend () |
| Get the plot's legend | |
| const QwtAbstractLegend * | legend () const |
| Get the plot's legend | |
| void | updateLegend () |
| Emit legendDataChanged() for all plot item | |
| void | updateLegend (const QwtPlotItem *) |
| Emit legendDataChanged() for a plot item | |
| virtual QSize | sizeHint () const override |
| virtual QSize | minimumSizeHint () const override |
| Return a minimum size hint | |
| virtual void | updateLayout () |
| Adjust plot content to its current size. | |
| virtual void | drawCanvas (QPainter *) |
| Redraw the canvas. | |
| void | updateAxes () |
| Rebuild the axes scales | |
| void | updateCanvasMargins () |
| Update the canvas margins | |
| virtual void | getCanvasMarginsHint (const QwtScaleMap maps[], const QRectF &canvasRect, double &left, double &top, double &right, double &bottom) const |
| Calculate the canvas margins | |
| virtual bool | event (QEvent *) override |
| Adds handling of layout requests | |
| virtual bool | eventFilter (QObject *, QEvent *) override |
| Event filter | |
| virtual void | drawItems (QPainter *, const QRectF &, const QwtScaleMap maps[QwtAxis::AxisPositions]) const |
| Redraw the canvas items. | |
| virtual QVariant | itemToInfo (QwtPlotItem *) const |
| Build an information, that can be used to identify a plot item on the legend. | |
| virtual QwtPlotItem * | infoToItem (const QVariant &) const |
| Identify the plot item according to an item info object, that has bee generated from itemToInfo(). | |
| QwtPlot * | createParasitePlot (QwtAxis::Position enableAxis) |
| Create parasite axes for this plot | |
| void | setParasiteShareAxis (QwtAxisId axisId, bool isShare=true) |
| Set whether the parasite axis shares the host's specified axis, only valid for parasite axes | |
| bool | isParasiteShareAxis (QwtAxisId axisId) const |
| Query whether the parasite axis shares the host's specified axis | |
| void | removeParasitePlot (QwtPlot *parasite) |
| Remove a parasite plot from this host plot | |
| QList< QwtPlot * > | parasitePlots () const |
| Get all parasite plots associated with this host plot | |
| QList< QwtPlot * > | plotList (bool descending=false) const |
| Return all plots, including the host plot | |
| QwtPlot * | parasitePlotAt (int index) const |
| Get the nth parasite plot | |
| int | parasitePlotIndex (QwtPlot *parasite) const |
| Parasite plot index (level) | |
| QwtPlot * | hostPlot () const |
| Get the host plot for this parasite plot | |
| bool | isParasitePlot () const |
| Check if this plot is a parasite plot | |
| bool | isTopParasitePlot () const |
| Whether this is the topmost parasite plot; the topmost parasite's axes are at the outermost layer and are typically updated last | |
| bool | isHostPlot () const |
| Check if this plot is a host plot | |
| void | setBackgroundColor (const QColor &c) |
| Set background color | |
| QColor | backgroundColor () const |
| Get background color | |
| void | syncAxis (QwtAxisId axis, const QwtPlot *plot) |
| Synchronize the axis ranges from the given plot to this plot | |
| void | rescaleAxes (bool onlyVisibleItems=true, double marginPercent=0.05, QwtAxisId xAxis=QwtPlot::xBottom, QwtAxisId yAxis=QwtPlot::yLeft) |
| Rescale axes to fit all data items | |
| void | setAxisToLogScale (QwtAxisId axisId) |
| Set the specified axis to logarithmic scale | |
| void | setAxisToDateTime (QwtAxisId axisId, Qt::TimeSpec timeSpec=Qt::LocalTime) |
| Set the specified axis to date-time scale | |
| void | setAxisToLinearScale (QwtAxisId axisId) |
| Restore the specified axis to linear scale | |
| void | alignToHost () |
| Align the parasite plot to the host plot | |
| int | parasitePlotCount () const |
| Get the number of parasite plots | |
| void | updateAxisEdgeMargin (QwtAxisId axisId) |
| Recalculate and assign edgeMargin and margin for all layers (host + parasite) axes based on level order | |
| void | updateAllAxisEdgeMargin () |
| Batch update edge offsets for all axis positions | |
| void | alignAxisBorderDist (QwtAxisId axisId) |
| Align borderDist across host and all parasite layers for one axis | |
| void | alignAllAxisBorderDist () |
| Align borderDist for all axis positions | |
| void | updateItemsToScaleDiv () |
| Update the scale range of all plot items to match the current axis scales. | |
| void | setEnableScaleBuildinActions (bool on) |
| Enable or disable built-in axis event actions | |
| bool | isEnableScaleBuildinActions () const |
| Check if built-in axis event actions are enabled | |
| void | setupScaleEventDispatcher (QwtPlotScaleEventDispatcher *dispatcher) |
| Install the axis event dispatcher | |
| void | saveAutoReplotState () |
| Save the current autoReplot state | |
| void | restoreAutoReplotState () |
| Restore the previously saved autoReplot state | |
| void | panAxis (QwtAxisId axisId, int deltaPixels) |
| Pan the specified axis by a given number of pixels | |
| void | panCanvas (const QPoint &offset) |
| Pan the entire canvas by a pixel offset | |
| void | zoomAxis (QwtAxisId axisId, double factor, const QPoint ¢erPosPixels) |
| Zoom the axis centered at the specified pixel position | |
| void | enableAxis (int axisId, bool on=true) |
| bool | axisEnabled (int axisId) const |
 Public 成员函数 继承自 QwtPlotDict Public 成员函数 继承自 QwtPlotDict | |
| QwtPlotDict () | |
| Constructor | |
| void | setAutoDelete (bool) |
| Enable/disable auto deletion | |
| bool | autoDelete () const |
| Check if auto deletion is enabled | |
| const QwtPlotItemList & | itemList () const |
| Get the list of all attached plot items | |
| QwtPlotItemList | itemList (int rtti) const |
| Get the list of all attached plot items of a specific type | |
| void | detachItems (int rtti=QwtPlotItem::Rtti_PlotItem, bool autoDelete=true) |
| Detach items from the dictionary | |
Protected 成员函数 | |
| virtual void | resizeEvent (QResizeEvent *) override |
| Resize and update internal layout | |
| void | addParasitePlot (QwtPlot *parasite) |
| Add a parasite plot to this host plot | |
| void | initParasiteAxes (QwtPlot *parasitePlot) const |
| Initialize basic properties of the parasite axes | |
| void | doLayout () |
| Adjust plot content to its current size. | |
| void | drawInsideTicks (QPainter *, const QRectF &canvasRect, const QwtScaleMap maps[QwtAxis::AxisPositions]) const |
| Draw inside ticks for axes with TickInside direction | |
| Protected 成员函数 继承自 QwtPlotDict | |
| void | insertItem (QwtPlotItem *) |
| Insert an item into the dictionary | |
| void | removeItem (QwtPlotItem *) |
| Remove an item from the dictionary | |
属性 | |
| QBrush | canvasBackground |
| bool | autoReplot |
友元 | |
| class | QwtFigure |
| class | QwtPlotItem |
详细描述
A 2-D plotting widget
QwtPlot is a widget for plotting two-dimensional graphs. An unlimited number of plot items can be displayed on its canvas. Plot items might be curves (QwtPlotCurve), markers (QwtPlotMarker), the grid (QwtPlotGrid), or anything else derived from QwtPlotItem. A plot can have up to four axes, with each plot item attached to an x- and a y axis. The scales at the axes can be explicitly set (QwtScaleDiv), or are calculated from the plot items, using algorithms (QwtScaleEngine) which can be configured separately for each axis.
The simpleplot example is a good starting point to see how to set up a plot widget.

- Example
- The following example shows (schematically) the most simple way to use QwtPlot. By default, only the left and bottom axes are visible and their scales are computed automatically. #include <qwt_plot.h>#include <qwt_plot_curve.h>// add curves// connect or copy the data to the curvescurve1->setData( ... );curve2->setData( ... );curve1->attach( myPlot );curve2->attach( myPlot );// finally, refresh the plotmyPlot->replot();void attach(QwtPlot *plot) overrideAttach the curve to a plotDefinition qwt_plot_curve.cpp:166
成员枚举类型说明
◆ LegendPosition
Position of the legend, relative to the canvas
| 枚举值 | |
|---|---|
| LeftLegend | The legend will be left from the QwtAxis::YLeft axis The legend will be right from the QwtAxis::YRight axis |
| RightLegend | The legend will be below the footer |
| BottomLegend | The legend will be above the title |
◆ TickDirection
Tick direction enum
Controls whether ticks are drawn inside or outside the canvas. When ticks are inside, they are drawn from the canvas edge toward the interior, while the backbone and labels remain outside.
| 枚举值 | |
|---|---|
| TickOutside | Ticks are drawn outside the canvas (default behavior) Ticks are drawn inside the canvas |
构造及析构函数说明
◆ QwtPlot()
|
explicit |
成员函数说明
◆ addParasitePlot()
|
protected |
Add a parasite plot to this host plot
This method establishes a parasite relationship where the specified plot will be treated as a parasite of this host plot. The parasite plot will automatically synchronize its geometry with the host plot.
- 参数
-
parasite Pointer to the parasite QwtPlot
- 注解
- This method is typically called internally by QwtFigure::createParasiteAxes().
- The parasite plot should have a transparent background to avoid obscuring the host plot.
◆ alignAllAxisBorderDist()
| void QwtPlot::alignAllAxisBorderDist | ( | ) |
Align borderDist for all axis positions
◆ alignAxisBorderDist()
| void QwtPlot::alignAxisBorderDist | ( | QwtAxisId | axisId | ) |
Align borderDist across host and all parasite layers for one axis
For each axis position, the host and every parasite compute their own borderDist hint (endpoint label spacing) independently. If they differ, canvasMap produces different paint intervals for host vs. parasite, which causes parasite curves to be misaligned, compressed, or rendered outside the canvas.
This method computes the maximum start/end borderDist across all layers (host + parasites) and applies it to every layer, ensuring all canvasMap paint intervals are identical. Setting minBorderDist as well prevents subsequent doLayout / updateAxes calls from reverting below this value.
- 参数
-
axisId Axis ID to align
◆ autoRefresh
|
slot |
Replots the plot if autoReplot() is enabled
This method is called internally when plot properties change and autoReplot is enabled.
◆ autoReplot()
| bool QwtPlot::autoReplot | ( | ) | const |
◆ axisAutoScale()
| bool QwtPlot::axisAutoScale | ( | QwtAxisId | axisId | ) | const |
Return whether autoscaling is enabled
- 参数
-
axisId Axis ID
- 返回
trueif autoscaling is enabled
◆ axisFont()
| QFont QwtPlot::axisFont | ( | QwtAxisId | axisId | ) | const |
Return the font of the scale labels for a specified axis
- 参数
-
axisId Axis ID
- 返回
- Font
◆ axisInterval()
| QwtInterval QwtPlot::axisInterval | ( | QwtAxisId | axisId | ) | const |
Return the current interval of the specified axis
This is only a convenience function for axisScaleDiv( axisId )->interval();
- 参数
-
axisId Axis ID
- 返回
- Scale interval
◆ axisMaxMajor()
| int QwtPlot::axisMaxMajor | ( | QwtAxisId | axisId | ) | const |
Return the maximum number of major ticks for a specified axis
- 参数
-
axisId Axis ID
◆ axisMaxMinor()
| int QwtPlot::axisMaxMinor | ( | QwtAxisId | axisId | ) | const |
Return the maximum number of minor ticks for a specified axis
- 参数
-
axisId Axis ID
◆ axisScaleDiv()
| const QwtScaleDiv & QwtPlot::axisScaleDiv | ( | QwtAxisId | axisId | ) | const |
Return the scale division of a specified axis
axisScaleDiv(axisId).lowerBound(), axisScaleDiv(axisId).upperBound() are the current limits of the axis scale.
- 参数
-
axisId Axis ID
- 返回
- Scale division
◆ axisScaleDraw() [1/2]
| QwtScaleDraw * QwtPlot::axisScaleDraw | ( | QwtAxisId | axisId | ) |
Return the scale draw of a specified axis
- 参数
-
axisId Axis ID
- 返回
- Specified scaleDraw for axis, or nullptr if axis is invalid.
◆ axisScaleDraw() [2/2]
| const QwtScaleDraw * QwtPlot::axisScaleDraw | ( | QwtAxisId | axisId | ) | const |
Return the scale draw of a specified axis
- 参数
-
axisId Axis ID
- 返回
- Specified scaleDraw for axis, or nullptr if axis is invalid.
◆ axisScaleEngine() [1/2]
| QwtScaleEngine * QwtPlot::axisScaleEngine | ( | QwtAxisId | axisId | ) |
Return the scale engine for a specific axis
- 参数
-
axisId Axis ID
- 返回
- Scale engine
◆ axisScaleEngine() [2/2]
| const QwtScaleEngine * QwtPlot::axisScaleEngine | ( | QwtAxisId | axisId | ) | const |
Return the scale engine for a specific axis (const overload)
- 参数
-
axisId Axis ID
- 返回
- Scale engine
◆ axisStepSize()
| double QwtPlot::axisStepSize | ( | QwtAxisId | axisId | ) | const |
Return the step size parameter that has been set in setAxisScale.
This doesn't need to be the step size of the current scale.
- 参数
-
axisId Axis ID
- 返回
- step size parameter value
◆ axisTickDirection()
| QwtPlot::TickDirection QwtPlot::axisTickDirection | ( | QwtAxisId | axisId | ) | const |
Get the tick direction for an axis
- 参数
-
axisId Axis identifier
- 返回
- Current tick direction
◆ axisTitle()
| QwtText QwtPlot::axisTitle | ( | QwtAxisId | axisId | ) | const |
Get the title of a specified axis
- 参数
-
axisId Axis ID
- 返回
- Title of a specified axis
◆ axisTitleAlignment()
| Qt::Alignment QwtPlot::axisTitleAlignment | ( | QwtAxisId | axisId | ) | const |
Get the horizontal alignment of an axis title
- 参数
-
axisId Axis ID
- 返回
- Horizontal alignment within the title box
◆ axisTitlePlacement()
| QwtScaleWidget::TitlePlacement QwtPlot::axisTitlePlacement | ( | QwtAxisId | axisId | ) | const |
◆ axisTitlePosition()
| QwtScaleWidget::TitlePosition QwtPlot::axisTitlePosition | ( | QwtAxisId | axisId | ) | const |
Get the position of an axis title along the backbone
- 参数
-
axisId Axis ID
- 返回
- Title position along the backbone
◆ axisWidget() [1/2]
| QwtScaleWidget * QwtPlot::axisWidget | ( | QwtAxisId | axisId | ) |
Return the scale widget of the specified axis
- 参数
-
axisId Axis ID
- 返回
- Scale widget, or nullptr if axisId is invalid
◆ axisWidget() [2/2]
| const QwtScaleWidget * QwtPlot::axisWidget | ( | QwtAxisId | axisId | ) | const |
Return the scale widget of the specified axis
- 参数
-
axisId Axis ID
- 返回
- Scale widget, or nullptr if axisId is invalid
◆ backgroundColor()
| QColor QwtPlot::backgroundColor | ( | ) | const |
Get background color
- 返回
- Background color
◆ canvas() [1/2]
| QWidget * QwtPlot::canvas | ( | ) |
Get the plot's canvas
- 返回
- The plot's canvas widget
◆ canvas() [2/2]
| const QWidget * QwtPlot::canvas | ( | ) | const |
Get the plot's canvas
- 返回
- The plot's canvas widget (const)
◆ canvasBackground()
| QBrush QwtPlot::canvasBackground | ( | ) | const |
Nothing else than: canvas()->palette().brush( QPalette::Normal, QPalette::Window);
- 返回
- Background brush of the plotting area.
◆ canvasMap()
|
virtual |
- 参数
-
axisId Axis
- 返回
- Map for the axis on the canvas. With this map pixel coordinates can translated to plot coordinates and vice versa.
◆ colorCycle()
| QwtColorCycle QwtPlot::colorCycle | ( | ) | const |
◆ createParasitePlot()
| QwtPlot * QwtPlot::createParasitePlot | ( | QwtAxis::Position | enableAxis | ) |
Create parasite axes for this plot
This method creates a parasite axes that shares the same plotting area as the host plot but with independent axis scaling and labeling. The parasite axes will be positioned exactly on top of the host plot and will automatically synchronize its geometry.
- 参数
-
enableAxis The axis position to enable on the parasite axes
- 返回
- Pointer to the created parasite QwtPlot
- 返回值
-
nullptr if hostPlot is invalid or not in the figure
- 注解
- A plot cannot be both a parasite and a host at the same time. That is, if a plot is a parasite plot, it is not allowed to create further parasite plots. Calling this function on a parasite plot will return nullptr.
◆ doLayout()
|
protected |
Adjust plot content to its current size.
The concrete implementation of updateLayout. Before version 7.0, there were no parasite axes. Since the size information of parasite axes fully references the host axes, during the updateLayout process, parasite axes should not perform any actions. Instead, after the host axis's updateLayout finishes, doLayout is executed for all parasite axes.
Therefore, all implementation of updateLayout is extracted into doLayout.
◆ drawCanvas()
|
virtual |
Redraw the canvas.
- 参数
-
painter Painter used for drawing
- 警告
- drawCanvas calls drawItems what is also used for printing. Applications that like to add individual plot items better overload drawItems()
◆ drawInsideTicks()
|
protected |
Draw inside ticks for axes with TickInside direction
This method is called after drawItems() to draw tick marks that extend from the canvas edge toward the interior.
- 参数
-
painter Painter canvasRect Canvas rectangle maps Scale maps for all axes
◆ drawItems()
|
virtual |
Redraw the canvas items.
- 参数
-
painter Painter used for drawing canvasRect Bounding rectangle where to paint maps QwtAxis::AxisCount maps, mapping between plot and paint device coordinates
- 注解
- Usually canvasRect is contentsRect() of the plot canvas. Due to a bug in Qt this rectangle might be wrong for certain frame styles ( f.e QFrame::Box ) and it might be necessary to fix the margins manually using QWidget::setContentsMargins()
◆ event()
|
overridevirtual |
Adds handling of layout requests
- 参数
-
event Event
- 返回
- See QFrame::event()
◆ eventFilter()
|
overridevirtual |
Event filter
The plot handles the following events for the canvas:
- QEvent::Resize The canvas margins might depend on its size
- QEvent::ContentsRectChange The layout needs to be recalculated
- For parasite axes, the parasite axis filters the host axis dimensions and adjusts its own dimensions
- 参数
-
object Object to be filtered event Event
- 返回
- See QFrame::eventFilter()
◆ footer()
| QwtText QwtPlot::footer | ( | ) | const |
Get the footer text
- 返回
- Text of the footer
◆ footerLabel() [1/2]
| QwtTextLabel * QwtPlot::footerLabel | ( | ) |
Get the footer label widget
- 返回
- Footer label widget
◆ footerLabel() [2/2]
| const QwtTextLabel * QwtPlot::footerLabel | ( | ) | const |
Get the footer label widget
- 返回
- Footer label widget (const)
◆ getCanvasMarginsHint()
|
virtual |
Calculate the canvas margins
- 参数
-
maps QwtAxis::AxisCount maps, mapping between plot and paint device coordinates canvasRect Bounding rectangle where to paint left Return parameter for the left margin top Return parameter for the top margin right Return parameter for the right margin bottom Return parameter for the bottom margin
Plot items might indicate, that they need some extra space at the borders of the canvas by the QwtPlotItem::Margins flag.
◆ hostPlot()
| QwtPlot * QwtPlot::hostPlot | ( | ) | const |
Get the host plot for this parasite plot
This method returns the host plot of this parasite plot, or nullptr if this plot is not a parasite.
- 返回
- Pointer to the host QwtPlot
- 返回值
-
nullptr if this plot is not a parasite plot
◆ infoToItem()
|
virtual |
Identify the plot item according to an item info object, that has bee generated from itemToInfo().
The default implementation simply tries to unwrap a QwtPlotItem pointer:
- 参数
-
itemInfo Plot item
- 返回
- A plot item, when successful, otherwise a nullptr pointer.
◆ initParasiteAxes()
|
protected |
Initialize basic properties of the parasite axes
- 参数
-
parasitePlot The parasite plot to initialize
◆ insertLegend()
| void QwtPlot::insertLegend | ( | QwtAbstractLegend * | legend, |
| QwtPlot::LegendPosition | pos = QwtPlot::RightLegend, |
||
| double | ratio = -1.0 |
||
| ) |
Insert a legend
If the position legend is QwtPlot::LeftLegend or QwtPlot::RightLegend the legend will be organized in one column from top to down. Otherwise the legend items will be placed in a table with a best fit number of columns from left to right.
insertLegend() will set the plot widget as parent for the legend. The legend will be deleted in the destructor of the plot or when another legend is inserted.
Legends, that are not inserted into the layout of the plot widget need to connect to the legendDataChanged() signal. Calling updateLegend() initiates this signal for an initial update. When the application code wants to implement its own layout this also needs to be done for rendering plots to a document ( see QwtPlotRenderer ).
- 参数
-
legend Legend pos The legend's position. For top/left position the number of columns will be limited to 1, otherwise it will be set to unlimited. ratio Ratio between legend and the bounding rectangle of title, canvas and axes. The legend will be shrunk if it would need more space than the given ratio. The ratio is limited to ]0.0 .. 1.0]. In case of <= 0.0 it will be reset to the default ratio. The default vertical/horizontal ratio is 0.33/0.5.
◆ invTransform()
| double QwtPlot::invTransform | ( | QwtAxisId | axisId, |
| double | pos | ||
| ) | const |
Transform the x or y coordinate of a position in the drawing region into a value.
Transform the x or y coordinate of a position in the drawing region into a value.
- 参数
-
axisId Axis ID pos position
- 返回
- Position as axis coordinate
- 警告
- The position can be an x or a y coordinate, depending on the specified axis.
◆ isAxisValid()
| bool QwtPlot::isAxisValid | ( | QwtAxisId | axisId | ) | const |
Checks if an axis is valid
- 参数
-
axisId axis ID
- 返回
trueif the specified axis exists, otherwisefalse
- 注解
- This method is equivalent to QwtAxis::isValid( axisId ) and simply checks if axisId is one of the values of QwtAxis::Position. It is a placeholder for future releases, where it will be possible to have a customizable number of axes ( multiaxes branch ) at each side.
◆ isAxisVisible()
| bool QwtPlot::isAxisVisible | ( | QwtAxisId | axisId | ) | const |
Return whether the specified axis is visible
- 参数
-
axisId Axis ID
- 返回
trueif the axis is visible
◆ isEnableScaleBuildinActions()
| bool QwtPlot::isEnableScaleBuildinActions | ( | ) | const |
Check if built-in axis event actions are enabled
- 返回
- true if enabled
◆ isHostPlot()
| bool QwtPlot::isHostPlot | ( | ) | const |
Check if this plot is a host plot
This method returns true if this plot has one or more parasite plots.
A plot is only considered a host if it holds parasite plots.
- 注解
- A plot cannot be both a parasite and a host at the same time, meaning a host itself is not allowed to be parasitic on another plot.
- 返回
- true if this plot has parasite plots
- false if this plot has no parasite plots
◆ isParasitePlot()
| bool QwtPlot::isParasitePlot | ( | ) | const |
Check if this plot is a parasite plot
This method returns true if this plot is a parasite of another plot.
- 返回
- true if this plot is a parasite plot
- false if this plot is not a parasite plot
◆ isParasiteShareAxis()
| bool QwtPlot::isParasiteShareAxis | ( | QwtAxisId | axisId | ) | const |
Query whether the parasite axis shares the host's specified axis
- 参数
-
axisId The axis ID to query
- 返回
- true if the current parasite axis shares the corresponding host axis; false otherwise
◆ isTopParasitePlot()
| bool QwtPlot::isTopParasitePlot | ( | ) | const |
Whether this is the topmost parasite plot; the topmost parasite's axes are at the outermost layer and are typically updated last
- 返回
- true if this is the topmost parasite plot
◆ itemAttached
|
signal |
A signal indicating that an item has been attached/detached
- 参数
-
plotItem Plot item on Attached/Detached
◆ itemToInfo()
|
virtual |
Build an information, that can be used to identify a plot item on the legend.
The default implementation simply wraps the plot item into a QVariant object. When overloading itemToInfo() usually infoToItem() needs to reimplemeted too.
- 参数
-
plotItem Plot item
- 返回
- Plot item embedded in a QVariant
◆ legend() [1/2]
| QwtAbstractLegend * QwtPlot::legend | ( | ) |
◆ legend() [2/2]
| const QwtAbstractLegend * QwtPlot::legend | ( | ) | const |
◆ legendDataChanged
|
signal |
A signal with the attributes how to update the legend entries for a plot item.
- 参数
-
itemInfo Info about a plot item, built from itemToInfo() data Attributes of the entries (usually <= 1) for the plot item.
- 参见
- itemToInfo(), infoToItem(), QwtAbstractLegend::updateLegend()
◆ nextColorForItem()
| QColor QwtPlot::nextColorForItem | ( | int | rtti | ) |
Get the next auto-assigned color for a plot item type
Returns the next color from the color cycle for the given rtti type. Each rtti type maintains an independent counter, so curves and bar charts each start from the first palette color.
- 参数
-
rtti The rtti value of the plot item (e.g. QwtPlotItem::Rtti_PlotCurve)
- 返回
- Next color from the cycle
◆ panAxis()
| void QwtPlot::panAxis | ( | QwtAxisId | axisId, |
| int | deltaPixels | ||
| ) |
Pan the specified axis by a given number of pixels
- 参数
-
axisId Axis ID (QwtPlot::xBottom, QwtPlot::yLeft, etc.) deltaPixels Number of pixels to move
Positive values move right/down, negative values move left/up. For logarithmic axes, coordinate transformations are handled automatically.
- 注解
- This function does not trigger a repaint; the caller must manually call replot
◆ panCanvas()
| void QwtPlot::panCanvas | ( | const QPoint & | offset | ) |
Pan the entire canvas by a pixel offset
- 参数
-
offset Pixel offset
This method translates all axes (whether enabled or not) by the specified pixel offset, achieving a synchronized panning effect for the entire canvas. Horizontal direction: positive moves right, negative moves left Vertical direction: positive moves down, negative moves up
- 注解
- This function does not trigger a repaint; the caller must manually call replot
◆ parasitePlotAt()
| QwtPlot * QwtPlot::parasitePlotAt | ( | int | index | ) | const |
Get the nth parasite plot
- 参数
-
index Index
- 返回
- nullptr if out of range or if this plot is a parasite plot
◆ parasitePlotAttached
|
signal |
Identify the relationship between the parasitic plot and its host plot
- 参数
-
parasitePlot Parasite plot on When a parasitic plot is added, on = true. When the parasitic plot is removed, on = false.
- 注解
- This signal is emitted only by the host plot.
◆ parasitePlotCount()
| int QwtPlot::parasitePlotCount | ( | ) | const |
Get the number of parasite plots
- 返回
- 0 if this plot is a parasite plot, otherwise the count of parasite plots
◆ parasitePlotIndex()
| int QwtPlot::parasitePlotIndex | ( | QwtPlot * | parasite | ) | const |
Parasite plot index (level)
The parasite level is determined by the order of addition. The first parasite added is at level 0, the second at level 1, and so on. The higher the level, the closer the axis is to the plot boundary.
- 参数
-
parasite Parasite plot
- 返回
- -1 if invalid index
- 注解
- If the passed parasite is not a parasite of this plot, returns -1
- This function is only valid for host plots; calling it on a parasite plot also returns -1
◆ parasitePlots()
Get all parasite plots associated with this host plot
This method returns a list of all parasite plots that are associated with this host plot.
- 返回
- List of parasite QwtPlot pointers
◆ plotId()
| QString QwtPlot::plotId | ( | ) | const |
Plot ID
The plot ID is provided to enable a Figure to identify individual plots during persistence.
For example, after saving a Figure in XML format, it is necessary to know which plots have established axis synchronization signals with which other plots, and which plot boundaries have been aligned. These tasks require locating specific plots, which can be achieved using the plot ID.
- 返回
- A unique UUID
◆ plotLayout() [1/2]
| QwtPlotLayout * QwtPlot::plotLayout | ( | ) |
Get the plot's layout
- 返回
- The plot's layout
◆ plotLayout() [2/2]
| const QwtPlotLayout * QwtPlot::plotLayout | ( | ) | const |
Get the plot's layout
- 返回
- The plot's layout (const)
◆ plotList()
Return all plots, including the host plot
descending=false: ascending order, host plot first, lower levels first. descending=true: descending order, host at the end.
- 参数
-
descending Sort order
- 返回
- Ordered list of all plots
◆ removeParasitePlot()
| void QwtPlot::removeParasitePlot | ( | QwtPlot * | parasite | ) |
Remove a parasite plot from this host plot
This method removes the parasite relationship between this host plot and the specified plot.
- 参数
-
parasite Pointer to the parasite QwtPlot to remove
- 注解
- This method does not delete the parasite plot, it only removes the relationship.
◆ replot
|
virtualslot |
Redraw the plot
If the autoReplot option is not set (which is the default) or if any curves are attached to raw data, the plot has to be refreshed explicitly in order to make changes visible.
◆ rescaleAxes()
| void QwtPlot::rescaleAxes | ( | bool | onlyVisibleItems = true, |
| double | marginPercent = 0.05, |
||
| QwtAxisId | xAxis = QwtPlot::xBottom, |
||
| QwtAxisId | yAxis = QwtPlot::yLeft |
||
| ) |
Rescale axes to fit all data items
This function automatically adjusts the axis ranges to fit all visible data items in the plot. It calculates the bounding rectangle of all plot items and sets appropriate axis scales with optional margins.
- 参数
-
onlyVisibleItems If true, only visible items are considered marginPercent Percentage of margin to add around the data range xAxis The x-axis to rescale (default: QwtPlot::xBottom) yAxis The y-axis to rescale (default: QwtPlot::yLeft)
Basic usage:
Custom margin:
◆ resizeEvent()
|
overrideprotectedvirtual |
Resize and update internal layout
- 参数
-
e Resize event
◆ setAutoReplot()
| void QwtPlot::setAutoReplot | ( | bool | tf = true | ) |
Set or reset the autoReplot option
If the autoReplot option is set, the plot will be updated implicitly by manipulating member functions. Since this may be time-consuming, it is recommended to leave this option switched off and call replot() explicitly if necessary.
The autoReplot option is set to false by default, which means that the user has to call replot() in order to make changes visible.
- 参数
-
tf trueorfalse. Defaults totrue.
- 参见
- replot()
◆ setAxisAutoScale()
| void QwtPlot::setAxisAutoScale | ( | QwtAxisId | axisId, |
| bool | on = true |
||
| ) |
Enable autoscaling for a specified axis
This member function is used to switch back to autoscaling mode after a fixed scale has been set. Autoscaling is enabled by default.
- 参数
-
axisId Axis ID on On/Off
- 注解
- The autoscaling flag has no effect until updateAxes() is executed ( called by replot() ).
◆ setAxisFont()
| void QwtPlot::setAxisFont | ( | QwtAxisId | axisId, |
| const QFont & | font | ||
| ) |
Change the font of an axis
- 参数
-
axisId Axis ID font Font
- 警告
- This function changes the font of the tick labels, not of the axis title.
◆ setAxisLabelAlignment()
| void QwtPlot::setAxisLabelAlignment | ( | QwtAxisId | axisId, |
| Qt::Alignment | alignment | ||
| ) |
Change the alignment of the tick labels
- 参数
-
axisId Axis ID alignment Or'd Qt::AlignmentFlags see <qnamespace.h>
◆ setAxisLabelRotation()
| void QwtPlot::setAxisLabelRotation | ( | QwtAxisId | axisId, |
| double | rotation | ||
| ) |
Rotate all tick labels
- 参数
-
axisId Axis ID rotation Angle in degrees. When changing the label rotation, the label alignment might be adjusted too.
◆ setAxisMaxMajor()
| void QwtPlot::setAxisMaxMajor | ( | QwtAxisId | axisId, |
| int | maxMajor | ||
| ) |
Set the maximum number of major scale intervals for a specified axis
- 参数
-
axisId Axis ID maxMajor Maximum number of major steps
◆ setAxisMaxMinor()
| void QwtPlot::setAxisMaxMinor | ( | QwtAxisId | axisId, |
| int | maxMinor | ||
| ) |
Set the maximum number of minor scale intervals for a specified axis
- 参数
-
axisId Axis ID maxMinor Maximum number of minor steps
◆ setAxisScale()
| void QwtPlot::setAxisScale | ( | QwtAxisId | axisId, |
| double | min, | ||
| double | max, | ||
| double | stepSize = 0 |
||
| ) |
Disable autoscaling and specify a fixed scale for a selected axis
In updateAxes() the scale engine calculates a scale division from the specified parameters, that will be assigned to the scale widget. So updates of the scale widget usually happen delayed with the next replot.
- 参数
-
axisId Axis ID min Minimum of the scale max Maximum of the scale stepSize Major step size. If step == 0, the step size is calculated automatically using the maxMajor setting.
◆ setAxisScaleDiv()
| void QwtPlot::setAxisScaleDiv | ( | QwtAxisId | axisId, |
| const QwtScaleDiv & | scaleDiv | ||
| ) |
Disable autoscaling and specify a fixed scale for a selected axis.
The scale division will be stored locally only until the next call of updateAxes(). So updates of the scale widget usually happen delayed with the next replot.
- 参数
-
axisId Axis ID scaleDiv Scale division
◆ setAxisScaleDraw()
| void QwtPlot::setAxisScaleDraw | ( | QwtAxisId | axisId, |
| QwtScaleDraw * | scaleDraw | ||
| ) |
Set a scale draw
By passing scaleDraw it is possible to extend QwtScaleDraw functionality and let it take place in QwtPlot. Please note that scaleDraw has to be created with new and will be deleted by the corresponding QwtScale member ( like a child object ).
- 参数
-
axisId Axis ID scaleDraw Object responsible for drawing scales.
- 警告
- The attributes of scaleDraw will be overwritten by those of the previous QwtScaleDraw.
◆ setAxisScaleEngine()
| void QwtPlot::setAxisScaleEngine | ( | QwtAxisId | axisId, |
| QwtScaleEngine * | scaleEngine | ||
| ) |
Change the scale engine for an axis
- 参数
-
axisId Axis ID scaleEngine Scale engine
- 注解
- The old scale engine will be deleted
◆ setAxisTickDirection()
| void QwtPlot::setAxisTickDirection | ( | QwtAxisId | axisId, |
| TickDirection | direction | ||
| ) |
Set the tick direction for an axis
When set to TickInside, the tick marks are drawn from the canvas edge toward the interior. The outside tick component is disabled on the QwtScaleWidget, and inside ticks are drawn in drawCanvas.
- 参数
-
axisId Axis identifier direction Tick direction (TickOutside or TickInside)
◆ setAxisTitle() [1/2]
| void QwtPlot::setAxisTitle | ( | QwtAxisId | axisId, |
| const QString & | title | ||
| ) |
Change the title of a specified axis
- 参数
-
axisId Axis ID title axis title
◆ setAxisTitle() [2/2]
| void QwtPlot::setAxisTitle | ( | QwtAxisId | axisId, |
| const QwtText & | title | ||
| ) |
Change the title of a specified axis
- 参数
-
axisId Axis ID title Axis title
◆ setAxisTitleAlignment()
| void QwtPlot::setAxisTitleAlignment | ( | QwtAxisId | axisId, |
| Qt::Alignment | alignment | ||
| ) |
Set the horizontal alignment of an axis title
- 参数
-
axisId Axis ID alignment Horizontal alignment within the title box
◆ setAxisTitlePlacement()
| void QwtPlot::setAxisTitlePlacement | ( | QwtAxisId | axisId, |
| QwtScaleWidget::TitlePlacement | placement | ||
| ) |
Set the placement of an axis title (inside the scale widget or outside as caption)
With QwtScaleWidget::TitleOutside the title is painted as a horizontal caption below the scale widget (above it for XTop) instead of inside the widget. The plot layout reserves the caption strip automatically, for parasite plots the host layout aggregates the demands of all layers.
- 参数
-
axisId Axis ID placement Title placement
◆ setAxisTitlePosition()
| void QwtPlot::setAxisTitlePosition | ( | QwtAxisId | axisId, |
| QwtScaleWidget::TitlePosition | position | ||
| ) |
Set the position of an axis title along the backbone
- 参数
-
axisId Axis ID position Title position along the backbone
◆ setAxisToDateTime()
| void QwtPlot::setAxisToDateTime | ( | QwtAxisId | axisId, |
| Qt::TimeSpec | timeSpec = Qt::LocalTime |
||
| ) |
Set the specified axis to date-time scale
This method configures the axis to display date-time formatted labels using QwtDateScaleEngine and QwtDateScaleDraw. Data should be provided as milliseconds since epoch (QDateTime::toMSecsSinceEpoch).
- 参数
-
axisId Axis identifier, e.g., QwtPlot::xBottom, QwtPlot::yLeft timeSpec Time zone specification, defaults to Qt::LocalTime
- 参见
- setAxisToLogScale(), setAxisToLinearScale(), QwtDateScaleEngine, QDateTime::toMSecsSinceEpoch()
◆ setAxisToLinearScale()
| void QwtPlot::setAxisToLinearScale | ( | QwtAxisId | axisId | ) |
Restore the specified axis to linear scale
This method replaces the current scale engine and draw with default linear versions. Useful to revert from logarithmic or date-time scales.
- 参数
-
axisId Axis identifier, e.g., QwtPlot::xBottom, QwtPlot::yLeft
- 注解
- Previous scale engine and draw are deleted automatically.
◆ setAxisToLogScale()
| void QwtPlot::setAxisToLogScale | ( | QwtAxisId | axisId | ) |
Set the specified axis to logarithmic scale
This method replaces the current scale engine of the axis with QwtLogScaleEngine, enabling logarithmic scaling. All data values must be greater than zero.
- 参数
-
axisId Axis identifier, e.g., QwtPlot::xBottom, QwtPlot::yLeft
- 注解
- This method deletes the previous scale engine automatically. Data <= 0 will cause undefined behavior.
◆ setAxisVisible()
| void QwtPlot::setAxisVisible | ( | QwtAxisId | axisId, |
| bool | on = true |
||
| ) |
Hide or show a specified axis
Curves, markers and other items can be attached to hidden axes, and transformation of screen coordinates into values works as normal.
Only QwtAxis::XBottom and QwtAxis::YLeft are enabled by default.
- 参数
-
axisId Axis ID on true(visible) orfalse(hidden)
◆ setBackgroundColor()
| void QwtPlot::setBackgroundColor | ( | const QColor & | c | ) |
Set background color
- 参数
-
c Color
◆ setCanvas()
| void QwtPlot::setCanvas | ( | QWidget * | canvas | ) |
Set the drawing canvas of the plot widget
QwtPlot invokes methods of the canvas as meta methods ( see QMetaObject ). In opposite to using conventional C++ techniques like virtual methods they allow to use canvas implementations that are derived from QWidget or QGLWidget.
The following meta methods could be implemented:
- replot() When the canvas doesn't offer a replot method, QwtPlot calls update() instead.
- borderPath() The border path is necessary to clip the content of the canvas When the canvas doesn't have any special border ( f.e rounded corners ) it is o.k. not to implement this method.
The default canvas is a QwtPlotCanvas
- 参数
-
canvas Canvas Widget
- 参见
- canvas()
◆ setCanvasBackground()
| void QwtPlot::setCanvasBackground | ( | const QBrush & | brush | ) |
Change the background of the plotting area
Sets brush to QPalette::Window of all color groups of the palette of the canvas. Using canvas()->setPalette() is a more powerful way to set these colors.
- 参数
-
brush New background brush
- 参见
- canvasBackground()
◆ setColorCycle()
| void QwtPlot::setColorCycle | ( | const QwtColorCycle & | colorCycle | ) |
Set the color cycle used for automatic item coloring
When plot items (curves, bar charts, etc.) are attached without a user-specified pen or brush, they automatically receive a color from this color cycle.
- 参数
-
colorCycle Color cycle object
◆ setEnableScaleBuildinActions()
| void QwtPlot::setEnableScaleBuildinActions | ( | bool | on | ) |
Enable or disable built-in axis event actions
Axis events are built-in event actions for axes, primarily including click-to-move-axis, mouse wheel zoom, etc.
- 参数
-
on Enable state
◆ setFooter() [1/2]
| void QwtPlot::setFooter | ( | const QString & | text | ) |
Change the footer text
- 参数
-
[in] text New text of the footer as a string
◆ setFooter() [2/2]
| void QwtPlot::setFooter | ( | const QwtText & | text | ) |
Change the footer text
- 参数
-
[in] text New text of the footer as a QwtText
◆ setParasiteShareAxis()
| void QwtPlot::setParasiteShareAxis | ( | QwtAxisId | axisId, |
| bool | isShare = true |
||
| ) |
Set whether the parasite axis shares the host's specified axis, only valid for parasite axes
- 参数
-
axisId The axis ID to share (e.g., QwtAxis::YLeft) isShare Whether to enable sharing
◆ setPlotId()
| void QwtPlot::setPlotId | ( | const QString & | id | ) |
set the plot id.
- 参数
-
id
◆ setPlotLayout()
| void QwtPlot::setPlotLayout | ( | QwtPlotLayout * | layout | ) |
◆ setTitle() [1/2]
| void QwtPlot::setTitle | ( | const QString & | title | ) |
Change the plot's title
- 参数
-
[in] title New title as a string
◆ setTitle() [2/2]
| void QwtPlot::setTitle | ( | const QwtText & | title | ) |
Change the plot's title
- 参数
-
[in] title New title as a QwtText
◆ setupScaleEventDispatcher()
| void QwtPlot::setupScaleEventDispatcher | ( | QwtPlotScaleEventDispatcher * | dispatcher | ) |
Install the axis event dispatcher
- 参数
-
dispatcher The event dispatcher to install
◆ sizeHint()
|
overridevirtual |
- 返回
- Size hint for the plot widget
◆ syncAxis()
| void QwtPlot::syncAxis | ( | QwtAxisId | axis, |
| const QwtPlot * | plot | ||
| ) |
Synchronize the axis ranges from the given plot to this plot
- 参数
-
axis Axis ID plot Source plot to sync from
◆ title()
| QwtText QwtPlot::title | ( | ) | const |
Get the plot's title
- 返回
- Title of the plot
◆ titleLabel() [1/2]
| QwtTextLabel * QwtPlot::titleLabel | ( | ) |
Get the title label widget
- 返回
- Title label widget
◆ titleLabel() [2/2]
| const QwtTextLabel * QwtPlot::titleLabel | ( | ) | const |
Get the title label widget
- 返回
- Title label widget (const)
◆ transform()
| double QwtPlot::transform | ( | QwtAxisId | axisId, |
| double | value | ||
| ) | const |
Transform a value into a coordinate in the plotting region
- 参数
-
axisId Axis ID value value
- 返回
- X or Y coordinate in the plotting region corresponding to the value.
◆ updateAllAxisEdgeMargin()
| void QwtPlot::updateAllAxisEdgeMargin | ( | ) |
Batch update edge offsets for all axis positions
Sequentially calls updateAxisEdgeMargin(QwtAxisId) for all axis positions (YLeft, YRight, XBottom, XTop) of the current plot instance, automatically synchronizing edgeMargin and margin between the host and all parasite axes, ensuring no overlap between layers and proper alignment of plot areas in multi-axis scenarios.
Typical invocation timing:
- After a parasite plot is mounted or removed;
- After property changes that affect dimensions, such as axis visibility, label fonts, or tick lengths;
- When axis label width/height changes significantly due to host or parasite axis data range changes.
◆ updateAxes()
| void QwtPlot::updateAxes | ( | ) |
Rebuild the axes scales
In case of autoscaling the boundaries of a scale are calculated from the bounding rectangles of all plot items, having the QwtPlotItem::AutoScale flag enabled ( QwtScaleEngine::autoScale() ). Then a scale division is calculated ( QwtScaleEngine::divideScale() ) and assigned to scale widget.
When the scale boundaries have been assigned with setAxisScale() a scale division is calculated ( QwtScaleEngine::divideScale() ) for this interval and assigned to the scale widget.
When the scale has been set explicitly by setAxisScaleDiv() the locally stored scale division gets assigned to the scale widget.
The scale widget indicates modifications by emitting a QwtScaleWidget::scaleDivChanged() signal.
updateAxes() is usually called by replot().
◆ updateAxisEdgeMargin()
| void QwtPlot::updateAxisEdgeMargin | ( | QwtAxisId | axisId | ) |
Recalculate and assign edgeMargin and margin for all layers (host + parasite) axes based on level order
In the Qwt multi-axis system, a host plot can mount any number of parasite plots. Each parasite plot shares the same canvas position as the host but has its own independent axes. To avoid overlap between axis layers, two offsets need to be dynamically calculated for each axis:
- edgeMargin – The distance from the current axis to the canvas border, accumulated from the theoretical sizes of all axes at higher levels.
- margin – The distance from the current axis to the plot area, accumulated from the theoretical sizes of all axes at lower levels.
Level rules defined here:
- The host is always at level 0 (innermost layer);
- Parasite plots form levels 1, 2, 3... in the order they are mounted, with larger numbers being closer to the outside of the canvas.
Calculation flow:
- Collect the "net" rectangles of the host and all visible parasite axes (with old edgeMargin and margin stripped);
- For each level i:
- margin = sum of net rectangle sizes from level 0 to i-1;
- edgeMargin = sum of net rectangle sizes from level i+1 to the last level;
- Assign the new values to the corresponding axis's QwtScaleWidget;
- The host's margin is preserved (not overwriting values that users may have manually set).
Notes:
- If the current axis is not visible or the parasite plot does not use QwtParasitePlotLayout, it is skipped automatically;
- All rectangle dimensions within the function are taken as width or height based on axis direction: Y axes (YLeft/YRight) use width, X axes (XBottom/XTop) use height.
- 参数
-
axisId The axis ID to process
- 注解
- This function only modifies geometric offsets and does not trigger layout or repaint; the caller can subsequently call hostPlot->updateLayout() if needed.
- 参见
- QwtScaleWidget::setEdgeMargin(), QwtScaleWidget::setMargin(), QwtParasitePlotLayout::parasiteScaleRect()
- 自从
- 7.0.4
◆ updateCanvasMargins()
| void QwtPlot::updateCanvasMargins | ( | ) |
Update the canvas margins
Plot items might indicate, that they need some extra space at the borders of the canvas by the QwtPlotItem::Margins flag.
◆ updateItemsToScaleDiv()
| void QwtPlot::updateItemsToScaleDiv | ( | ) |
Update the scale range of all plot items to match the current axis scales.
This is typically called when axes change, forcing all plot items to update their ranges.
◆ updateLayout()
|
virtual |
Adjust plot content to its current size.
◆ updateLegend() [1/2]
| void QwtPlot::updateLegend | ( | ) |
Emit legendDataChanged() for all plot item
◆ updateLegend() [2/2]
| void QwtPlot::updateLegend | ( | const QwtPlotItem * | plotItem | ) |
Emit legendDataChanged() for a plot item
- 参数
-
plotItem Plot item
◆ visibleXAxisId()
| QwtAxisId QwtPlot::visibleXAxisId | ( | ) | const |
Return the currently visible X axis
Selection policy (descending priority):
- Axis must be visible (isAxisVisible() == true);
- If both XBottom and XTop are visible, prefer XBottom;
- If only one X axis is visible, return it;
- If both are invisible, return default QwtAxis::XBottom.
- 返回
- Selected X axis ID
◆ visibleYAxisId()
| QwtAxisId QwtPlot::visibleYAxisId | ( | ) | const |
Return the currently usable Y axis
Selection policy (descending priority):
- Axis must be visible;
- If both YLeft and YRight are visible, prefer YLeft;
- If only one Y axis is visible, return it;
- If both are invisible, return default QwtAxis::YLeft.
- 返回
- Selected Y axis ID
◆ zoomAxis()
| void QwtPlot::zoomAxis | ( | QwtAxisId | axisId, |
| double | factor, | ||
| const QPoint & | centerPosPixels | ||
| ) |
Zoom the axis centered at the specified pixel position
- 参数
-
axisId Axis ID factor Zoom factor (>1 for zoom in, <1 for zoom out) centerPosPixels Pixel position of the zoom center (relative to canvas)
Zoom principle:
- Linear axes: zoom centered at the mouse position linearly
- Logarithmic axes: zoom centered at the mouse position in the logarithmic domain
- 注解
- This function does not trigger a repaint; the caller must manually call replot
该类的文档由以下文件生成:
- /home/runner/work/QWT/QWT/src/plot/qwt_plot.h
- /home/runner/work/QWT/QWT/src/plot/qwt_plot.cpp
- /home/runner/work/QWT/QWT/src/plot/qwt_plot_axis.cpp