A plot item, which displays a spectrogram 更多...
#include <qwt_plot_spectrogram.h>
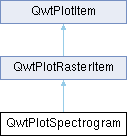
类 | |
| class | PrivateData |
Public 成员函数 | |
| QwtPlotSpectrogram (const QString &title=QString()) | |
| Constructor | |
| void | setDisplayMode (DisplayMode, bool on=true) |
| Set a display mode | |
| bool | testDisplayMode (DisplayMode) const |
| Test a display mode | |
| void | setData (QwtRasterData *data) |
| Set the data to be displayed | |
| const QwtRasterData * | data () const |
| Get the spectrogram data (const version) | |
| QwtRasterData * | data () |
| Get the spectrogram data | |
| void | setColorMap (QwtColorMap *) |
| Change the color map | |
| const QwtColorMap * | colorMap () const |
| Get the color map used for mapping intensity values to colors | |
| void | setColorTableSize (int numColors) |
| Limit the number of colors being used by the color map | |
| int | colorTableSize () const |
| Get the color table size | |
| virtual QwtInterval | interval (Qt::Axis) const override |
| Get the bounding interval for an axis | |
| virtual QRectF | pixelHint (const QRectF &) const override |
| Get the pixel hint | |
| void | setDefaultContourPen (const QColor &, qreal width=0.0, Qt::PenStyle=Qt::SolidLine) |
| Build and assign the default pen for the contour lines | |
| void | setDefaultContourPen (const QPen &) |
| Set the default pen for the contour lines | |
| QPen | defaultContourPen () const |
| Get the default contour pen | |
| virtual QPen | contourPen (double level) const |
| Calculate the pen for a contour line | |
| void | setConrecFlag (QwtRasterData::ConrecFlag, bool on) |
| Modify an attribute of the CONREC algorithm | |
| bool | testConrecFlag (QwtRasterData::ConrecFlag) const |
| Test an attribute of the CONREC algorithm | |
| void | setContourLevels (const QList< double > &) |
| Set the levels of the contour lines | |
| QList< double > | contourLevels () const |
| Get the levels of the contour lines | |
| virtual int | rtti () const override |
| Get the runtime type information | |
| virtual void | draw (QPainter *, const QwtScaleMap &xMap, const QwtScaleMap &yMap, const QRectF &canvasRect) const override |
| Draw the spectrogram | |
 Public 成员函数 继承自 QwtPlotRasterItem Public 成员函数 继承自 QwtPlotRasterItem | |
| QwtPlotRasterItem (const QString &title=QString()) | |
| Constructor | |
| QwtPlotRasterItem (const QwtText &title) | |
| void | setPaintAttribute (PaintAttribute, bool on=true) |
| Set a paint attribute | |
| bool | testPaintAttribute (PaintAttribute) const |
| Test a paint attribute | |
| void | setAlpha (int alpha) |
| Set an alpha value for the raster data | |
| int | alpha () const |
| Get the alpha value of the raster item | |
| void | setCachePolicy (CachePolicy) |
| Change the cache policy | |
| CachePolicy | cachePolicy () const |
| Get the cache policy | |
| void | invalidateCache () |
| Invalidate the paint cache | |
| virtual QRectF | boundingRect () const override |
| Get the bounding rectangle of the data | |
| Public 成员函数 继承自 QwtPlotItem | |
| QwtPlotItem () | |
| Default constructor | |
| QwtPlotItem (const QString &title) | |
| Constructor with title as QString | |
| QwtPlotItem (const QwtText &title) | |
| Constructor with title as QwtText | |
| virtual | ~QwtPlotItem () |
| Destructor | |
| virtual void | attach (QwtPlot *plot) |
| Attach the item to a plot | |
| void | detach () |
| Detach the item from the plot | |
| QwtPlot * | plot () const |
| Get the plot the item is attached to | |
| void | setTitle (const QString &title) |
| Set the title using a QString | |
| void | setTitle (const QwtText &title) |
| Set the title using a QwtText | |
| const QwtText & | title () const |
| Get the title | |
| void | setItemAttribute (ItemAttribute, bool on=true) |
| Set an item attribute | |
| bool | testItemAttribute (ItemAttribute) const |
| Test an item attribute | |
| void | setItemInterest (ItemInterest, bool on=true) |
| Set an item interest | |
| bool | testItemInterest (ItemInterest) const |
| Test an item interest | |
| void | setRenderHint (RenderHint, bool on=true) |
| Set a render hint | |
| bool | testRenderHint (RenderHint) const |
| Test a render hint | |
| void | setRenderThreadCount (uint numThreads) |
| Set the number of render threads | |
| uint | renderThreadCount () const |
| Get the number of render threads | |
| void | setLegendIconSize (const QSize &) |
| Set the legend icon size | |
| QSize | legendIconSize () const |
| Get the legend icon size | |
| double | z () const |
| Get the z-value | |
| void | setZ (double z) |
| Set the z-value | |
| void | show () |
| Show the item | |
| void | hide () |
| Hide the item | |
| virtual void | setVisible (bool) |
| Set the visibility | |
| bool | isVisible () const |
| Check if the item is visible | |
| void | setAxes (QwtAxisId xAxis, QwtAxisId yAxis) |
| Set both axes | |
| void | setXAxis (QwtAxisId) |
| Set the x-axis | |
| QwtAxisId | xAxis () const |
| Get the x-axis | |
| void | setYAxis (QwtAxisId) |
| Set the y-axis | |
| QwtAxisId | yAxis () const |
| Get the y-axis | |
| virtual void | itemChanged () |
| Notify the plot that the item has changed | |
| virtual void | legendChanged () |
| Notify the item that the legend has changed | |
| virtual void | getCanvasMarginHint (const QwtScaleMap &xMap, const QwtScaleMap &yMap, const QRectF &canvasRect, double &left, double &top, double &right, double &bottom) const |
| Get margin hints for the canvas | |
| virtual void | updateScaleDiv (const QwtScaleDiv &, const QwtScaleDiv &) |
| Update the item with new scale divisions | |
| virtual void | updateLegend (const QwtPlotItem *, const QList< QwtLegendData > &) |
| Update the item with changes of the legend | |
| QRectF | scaleRect (const QwtScaleMap &, const QwtScaleMap &) const |
| Calculate the scale rectangle | |
| QRectF | paintRect (const QwtScaleMap &, const QwtScaleMap &) const |
| Calculate the paint rectangle | |
| virtual QList< QwtLegendData > | legendData () const |
| Return legend data | |
| virtual QwtGraphic | legendIcon (int index, const QSizeF &) const |
| Return a legend icon | |
Protected 成员函数 | |
| virtual QImage | renderImage (const QwtScaleMap &xMap, const QwtScaleMap &yMap, const QRectF &area, const QSize &imageSize) const override |
| Render the image | |
| virtual QSize | contourRasterSize (const QRectF &, const QRect &) const |
| Calculate the contour raster size | |
| virtual QwtRasterData::ContourLines | renderContourLines (const QRectF &rect, const QSize &raster) const |
| Render the contour lines | |
| virtual void | drawContourLines (QPainter *, const QwtScaleMap &xMap, const QwtScaleMap &yMap, const QwtRasterData::ContourLines &) const |
| Draw the contour lines | |
| void | renderTile (const QwtScaleMap &xMap, const QwtScaleMap &yMap, const QRect &tile, QImage *) const |
| Render a tile | |
| Protected 成员函数 继承自 QwtPlotRasterItem | |
| virtual QwtScaleMap | imageMap (Qt::Orientation, const QwtScaleMap &map, const QRectF &area, const QSize &imageSize, double pixelSize) const |
| Get the image map | |
| Protected 成员函数 继承自 QwtPlotItem | |
| QwtGraphic | defaultIcon (const QBrush &, const QSizeF &) const |
| Create a default icon | |
详细描述
A plot item, which displays a spectrogram
A spectrogram displays 3-dimensional data, where the 3rd dimension ( the intensity ) is displayed using colors. The colors are calculated from the values using a color map.
On multi-core systems the performance of the image composition can often be improved by dividing the area into tiles - each of them rendered in a different thread ( see QwtPlotItem::setRenderThreadCount() ).
In ContourMode contour lines are painted for the contour levels.
成员枚举类型说明
◆ DisplayMode
构造及析构函数说明
◆ QwtPlotSpectrogram()
|
explicit |
Constructor
Sets the following item attributes:
- QwtPlotItem::AutoScale: true
- QwtPlotItem::Legend: false
The z value is initialized by 8.0.
- 参数
-
[in] title Title
Destructor
成员函数说明
◆ colorMap()
| const QwtColorMap * QwtPlotSpectrogram::colorMap | ( | ) | const |
Get the color map used for mapping intensity values to colors
- 返回
- Color map used for mapping the intensity values to colors
◆ colorTableSize()
| int QwtPlotSpectrogram::colorTableSize | ( | ) | const |
Get the color table size
- 返回
- Size of the color table, 0 means not using a color table
◆ contourLevels()
| QList< double > QwtPlotSpectrogram::contourLevels | ( | ) | const |
Get the levels of the contour lines
- 返回
- Levels of the contour lines. The levels are sorted in increasing order.
◆ contourPen()
|
virtual |
Calculate the pen for a contour line
The color of the pen is the color for level calculated by the color map.
- 参数
-
[in] level Contour level
- 返回
- Pen for the contour line
- 注解
- contourPen is only used if defaultContourPen().style() == Qt::NoPen
◆ contourRasterSize()
|
protectedvirtual |
Calculate the contour raster size
Return the raster to be used by the CONREC contour algorithm.
A larger size will improve the precision of the CONREC algorithm, but will slow down the time that is needed to calculate the lines.
The default implementation returns rect.size() / 2 bounded to the resolution depending on pixelSize().
- 参数
-
area Rectangle, where to calculate the contour lines rect Rectangle in pixel coordinates, where to paint the contour lines
- 返回
- Raster to be used by the CONREC contour algorithm.
- 注解
- The size will be bounded to rect.size().
◆ data() [1/2]
| QwtRasterData * QwtPlotSpectrogram::data | ( | ) |
◆ data() [2/2]
| const QwtRasterData * QwtPlotSpectrogram::data | ( | ) | const |
◆ defaultContourPen()
| QPen QwtPlotSpectrogram::defaultContourPen | ( | ) | const |
◆ draw()
|
overridevirtual |
Draw the spectrogram
- 参数
-
[in] painter Painter [in] xMap Maps x-values into pixel coordinates [in] yMap Maps y-values into pixel coordinates [in] canvasRect Contents rectangle of the canvas in painter coordinates
重载 QwtPlotRasterItem .
◆ drawContourLines()
|
protectedvirtual |
Draw the contour lines
Paint the contour lines
- 参数
-
painter Painter xMap Maps x-values into pixel coordinates. yMap Maps y-values into pixel coordinates. contourLines Contour lines
◆ interval()
|
overridevirtual |
Get the bounding interval for an axis
The default implementation returns the interval of the associated raster data object.
- 参数
-
[in] axis X, Y, or Z axis
- 返回
- Bounding interval for the axis
- 参见
- QwtRasterData::interval()
重载 QwtPlotRasterItem .
◆ pixelHint()
|
overridevirtual |
Get the pixel hint
The geometry of a pixel is used to calculated the resolution and alignment of the rendered image. The default implementation returns data()->pixelHint( rect ).
- 参数
-
[in] area In most implementations the resolution of the data doesn't depend on the requested area.
- 返回
- Bounding rectangle of a pixel
重载 QwtPlotRasterItem .
◆ renderContourLines()
|
protectedvirtual |
Render the contour lines
Calculate contour lines
- 参数
-
rect Rectangle, where to calculate the contour lines raster Raster, used by the CONREC algorithm
- 返回
- Calculated contour lines
◆ renderImage()
|
overrideprotectedvirtual |
Render the image
Render an image from data and color map.
For each pixel of area the value is mapped into a color.
- 参数
-
xMap X-Scale Map yMap Y-Scale Map area Requested area for the image in scale coordinates imageSize Size of the requested image
- 返回
- A QImage::Format_Indexed8 or QImage::Format_ARGB32 depending on the color map.
- 参见
- QwtRasterData::value(), QwtColorMap::rgb(), QwtColorMap::colorIndex()
实现了 QwtPlotRasterItem.
◆ renderTile()
|
protected |
Render a tile
Render a tile of an image.
Rendering in tiles can be used to composite an image in parallel threads.
- 参数
-
xMap X-Scale Map yMap Y-Scale Map tile Geometry of the tile in image coordinates image Image to be rendered
◆ rtti()
|
overridevirtual |
◆ setColorMap()
| void QwtPlotSpectrogram::setColorMap | ( | QwtColorMap * | colorMap | ) |
Change the color map
Often it is useful to display the mapping between intensities and colors as an additional plot axis, showing a color bar.
- 参数
-
[in] colorMap Color map
◆ setColorTableSize()
| void QwtPlotSpectrogram::setColorTableSize | ( | int | numColors | ) |
Limit the number of colors being used by the color map
When using a color table the mapping from the value into a color is usually faster as it can be done by simple lookups into a precalculated color table.
Setting a table size > 0 enables using a color table, while setting the size to 0 disables it. The default size = 0, and no color table is used.
- 参数
-
[in] numColors Number of colors. 0 means not using a color table
- 注解
- The colorTableSize has no effect when using a color table of QwtColorMap::Indexed, where the size is always 256.
◆ setConrecFlag()
| void QwtPlotSpectrogram::setConrecFlag | ( | QwtRasterData::ConrecFlag | flag, |
| bool | on | ||
| ) |
Modify an attribute of the CONREC algorithm
Used to calculate the contour lines.
- 参数
-
[in] flag CONREC flag [in] on On/Off
◆ setContourLevels()
| void QwtPlotSpectrogram::setContourLevels | ( | const QList< double > & | levels | ) |
Set the levels of the contour lines
- 参数
-
[in] levels Values of the contour levels
- 注解
- contourLevels returns the same levels but sorted.
◆ setData()
| void QwtPlotSpectrogram::setData | ( | QwtRasterData * | data | ) |
Set the data to be displayed
The ownership of the data is managed by QwtPlotSpectrogram.
- 参数
-
[in] data Spectrogram data
- 参见
- data()
◆ setDefaultContourPen() [1/2]
| void QwtPlotSpectrogram::setDefaultContourPen | ( | const QColor & | color, |
| qreal | width = 0.0, |
||
| Qt::PenStyle | style = Qt::SolidLine |
||
| ) |
Build and assign the default pen for the contour lines
In Qt5 the default pen width is 1.0 (0.0 in Qt4) what makes it non cosmetic (see QPen::isCosmetic()). This method has been introduced to hide this incompatibility.
- 参数
-
[in] color Pen color [in] width Pen width [in] style Pen style
◆ setDefaultContourPen() [2/2]
| void QwtPlotSpectrogram::setDefaultContourPen | ( | const QPen & | pen | ) |
Set the default pen for the contour lines
If the spectrogram has a valid default contour pen a contour line is painted using the default contour pen. Otherwise (pen.style() == Qt::NoPen) the pen is calculated for each contour level using contourPen().
- 参数
-
[in] pen New default pen
◆ setDisplayMode()
| void QwtPlotSpectrogram::setDisplayMode | ( | DisplayMode | mode, |
| bool | on = true |
||
| ) |
Set a display mode
The display mode controls how the raster data will be represented. The default setting enables ImageMode.
- 参数
-
[in] mode Display mode [in] on On/Off
◆ testConrecFlag()
| bool QwtPlotSpectrogram::testConrecFlag | ( | QwtRasterData::ConrecFlag | flag | ) | const |
Test an attribute of the CONREC algorithm
Used to calculate the contour lines. The default setting enables QwtRasterData::IgnoreAllVerticesOnLevel.
- 参数
-
[in] flag CONREC flag
- 返回
- true if enabled
◆ testDisplayMode()
| bool QwtPlotSpectrogram::testDisplayMode | ( | DisplayMode | mode | ) | const |
Test a display mode
The display mode controls how the raster data will be represented.
- 参数
-
[in] mode Display mode
- 返回
- true if mode is enabled
该类的文档由以下文件生成:
- /home/runner/work/QWT/QWT/src/plot/qwt_plot_spectrogram.h
- /home/runner/work/QWT/QWT/src/plot/qwt_plot_spectrogram.cpp