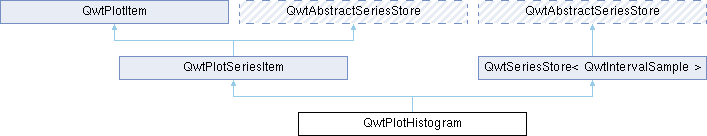
QwtPlotHistogram represents a series of samples, where an interval is associated with a value ( ![$y = f([x1,x2])$](form_3.png) )
更多...
)
更多...
#include <qwt_plot_histogram.h>
类 | |
| class | PrivateData |
Public 类型 | |
| enum | HistogramStyle { Outline , Columns , Lines , UserStyle = 100 } |
| Histogram styles 更多... | |
 Public 类型 继承自 QwtPlotItem Public 类型 继承自 QwtPlotItem | |
| enum | RttiValues { Rtti_PlotItem = 0 , Rtti_PlotGrid , Rtti_PlotScale , Rtti_PlotLegend , Rtti_PlotMarker , Rtti_PlotCurve , Rtti_PlotSpectroCurve , Rtti_PlotIntervalCurve , Rtti_PlotHistogram , Rtti_PlotSpectrogram , Rtti_PlotGraphic , Rtti_PlotTradingCurve , Rtti_PlotBarChart , Rtti_PlotMultiBarChart , Rtti_PlotShape , Rtti_PlotTextLabel , Rtti_PlotZone , Rtti_PlotVectorField , Rtti_PlotArrowMarker , Rtti_PlotBoxChart , Rtti_PlotUserItem = 1000 } |
| Runtime type information 更多... | |
| enum | ItemAttribute { Legend = 0x01 , AutoScale = 0x02 , Margins = 0x04 } |
| Plot Item Attributes 更多... | |
| enum | ItemInterest { ScaleInterest = 0x01 , LegendInterest = 0x02 } |
| Plot Item Interests 更多... | |
| enum | RenderHint { RenderAntialiased = 0x1 } |
| Render hints 更多... | |
Public 成员函数 | |
| QwtPlotHistogram (const QString &title=QString()) | |
| QwtPlotHistogram (const QwtText &title) | |
| Constructor with QwtText title | |
| virtual int | rtti () const override |
| Get the runtime type information | |
| void | attach (QwtPlot *plot) override |
| Attach the histogram to a plot | |
| void | setPen (const QColor &, qreal width=0.0, Qt::PenStyle=Qt::SolidLine) |
| Build and assign a pen | |
| void | setPen (const QPen &) |
| Assign a pen, that is used in a style() depending way | |
| const QPen & | pen () const |
| Get the pen used in a style() depending way | |
| void | setBrush (const QBrush &) |
| Assign a brush, that is used in a style() depending way | |
| const QBrush & | brush () const |
| Get the brush used in a style() depending way | |
| void | setSamples (const QVector< QwtIntervalSample > &) |
| Initialize data with an array of samples | |
| void | setSamples (QwtSeriesData< QwtIntervalSample > *) |
| Assign a series of samples | |
| void | setBaseline (double) |
| Set the value of the baseline | |
| double | baseline () const |
| Get the value of the baseline | |
| void | setStyle (HistogramStyle style) |
| Set the histogram's drawing style | |
| HistogramStyle | style () const |
| Get the histogram's drawing style | |
| void | setSymbol (const QwtColumnSymbol *) |
| Assign a symbol | |
| const QwtColumnSymbol * | symbol () const |
| Get the current symbol | |
| virtual void | drawSeries (QPainter *, const QwtScaleMap &xMap, const QwtScaleMap &yMap, const QRectF &canvasRect, int from, int to) const override |
| Draw a subset of the histogram samples | |
| virtual QRectF | boundingRect () const override |
| Get the bounding rectangle of all samples | |
| virtual QwtGraphic | legendIcon (int index, const QSizeF &) const override |
| A plain rectangle without pen using the brush() | |
| Public 成员函数 继承自 QwtPlotSeriesItem | |
| QwtPlotSeriesItem (const QString &title=QString()) | |
| QwtPlotSeriesItem (const QwtText &title) | |
| Constructor | |
| void | setOrientation (Qt::Orientation) |
| Set the orientation of the item | |
| Qt::Orientation | orientation () const |
| Get the orientation of the plot item | |
| virtual void | draw (QPainter *, const QwtScaleMap &xMap, const QwtScaleMap &yMap, const QRectF &canvasRect) const override |
| Draw the complete series | |
| virtual void | updateScaleDiv (const QwtScaleDiv &, const QwtScaleDiv &) override |
| Update the scale divisions | |
| Public 成员函数 继承自 QwtPlotItem | |
| QwtPlotItem () | |
| Default constructor | |
| QwtPlotItem (const QString &title) | |
| Constructor with title as QString | |
| QwtPlotItem (const QwtText &title) | |
| Constructor with title as QwtText | |
| virtual | ~QwtPlotItem () |
| Destructor | |
| void | detach () |
| Detach the item from the plot | |
| QwtPlot * | plot () const |
| Get the plot the item is attached to | |
| void | setTitle (const QString &title) |
| Set the title using a QString | |
| void | setTitle (const QwtText &title) |
| Set the title using a QwtText | |
| const QwtText & | title () const |
| Get the title | |
| void | setItemAttribute (ItemAttribute, bool on=true) |
| Set an item attribute | |
| bool | testItemAttribute (ItemAttribute) const |
| Test an item attribute | |
| void | setItemInterest (ItemInterest, bool on=true) |
| Set an item interest | |
| bool | testItemInterest (ItemInterest) const |
| Test an item interest | |
| void | setRenderHint (RenderHint, bool on=true) |
| Set a render hint | |
| bool | testRenderHint (RenderHint) const |
| Test a render hint | |
| void | setRenderThreadCount (uint numThreads) |
| Set the number of render threads | |
| uint | renderThreadCount () const |
| Get the number of render threads | |
| void | setLegendIconSize (const QSize &) |
| Set the legend icon size | |
| QSize | legendIconSize () const |
| Get the legend icon size | |
| double | z () const |
| Get the z-value | |
| void | setZ (double z) |
| Set the z-value | |
| void | show () |
| Show the item | |
| void | hide () |
| Hide the item | |
| virtual void | setVisible (bool) |
| Set the visibility | |
| bool | isVisible () const |
| Check if the item is visible | |
| void | setAxes (QwtAxisId xAxis, QwtAxisId yAxis) |
| Set both axes | |
| void | setXAxis (QwtAxisId) |
| Set the x-axis | |
| QwtAxisId | xAxis () const |
| Get the x-axis | |
| void | setYAxis (QwtAxisId) |
| Set the y-axis | |
| QwtAxisId | yAxis () const |
| Get the y-axis | |
| virtual void | itemChanged () |
| Notify the plot that the item has changed | |
| virtual void | legendChanged () |
| Notify the item that the legend has changed | |
| virtual void | getCanvasMarginHint (const QwtScaleMap &xMap, const QwtScaleMap &yMap, const QRectF &canvasRect, double &left, double &top, double &right, double &bottom) const |
| Get margin hints for the canvas | |
| virtual void | updateLegend (const QwtPlotItem *, const QList< QwtLegendData > &) |
| Update the item with changes of the legend | |
| QRectF | scaleRect (const QwtScaleMap &, const QwtScaleMap &) const |
| Calculate the scale rectangle | |
| QRectF | paintRect (const QwtScaleMap &, const QwtScaleMap &) const |
| Calculate the paint rectangle | |
| virtual QList< QwtLegendData > | legendData () const |
| Return legend data | |
| Public 成员函数 继承自 QwtSeriesStore< QwtIntervalSample > | |
| void | setData (QwtSeriesData< QwtIntervalSample > *series) |
| QwtSeriesData< QwtIntervalSample > * | data () |
| const QwtSeriesData< QwtIntervalSample > * | data () const |
| QwtIntervalSample | sample (size_t index) const |
| virtual size_t | dataSize () const override |
| virtual QRectF | dataRect () const override |
| virtual void | setRectOfInterest (const QRectF &rect) override |
| Set a the "rectangle of interest" for the stored series | |
| QwtSeriesData< QwtIntervalSample > * | swapData (QwtSeriesData< QwtIntervalSample > *series) |
Protected 成员函数 | |
| virtual QwtColumnRect | columnRect (const QwtIntervalSample &, const QwtScaleMap &, const QwtScaleMap &) const |
| Get the column rectangle | |
| virtual void | drawColumn (QPainter *, const QwtColumnRect &, const QwtIntervalSample &) const |
| Draw a column | |
| void | drawColumns (QPainter *, const QwtScaleMap &xMap, const QwtScaleMap &yMap, int from, int to) const |
| Draw columns | |
| void | drawOutline (QPainter *, const QwtScaleMap &xMap, const QwtScaleMap &yMap, int from, int to) const |
| Draw outline | |
| void | drawLines (QPainter *, const QwtScaleMap &xMap, const QwtScaleMap &yMap, int from, int to) const |
| Draw lines | |
| Protected 成员函数 继承自 QwtPlotSeriesItem | |
| virtual void | dataChanged () override |
| dataChanged() indicates, that the series has been changed. | |
| Protected 成员函数 继承自 QwtPlotItem | |
| QwtGraphic | defaultIcon (const QBrush &, const QSizeF &) const |
| Create a default icon | |
详细描述
QwtPlotHistogram represents a series of samples, where an interval is associated with a value ( )
The representation depends on the style() and an optional symbol() that is displayed for each interval.
- 注解
- The term "histogram" is used in a different way in the areas of digital image processing and statistics. Wikipedia introduces the terms "image histogram" and "color histogram" to avoid confusions. While "image histograms" can be displayed by a QwtPlotCurve there is no applicable plot item for a "color histogram" yet.
成员枚举类型说明
◆ HistogramStyle
Histogram styles
The default style is QwtPlotHistogram::Columns.
| 枚举值 | |
|---|---|
| Outline | Draw an outline around the area, that is build by all intervals using the pen() and fill it with the brush(). The outline style requires, that the intervals are in increasing order and not overlapping. |
| Columns | Draw a column for each interval. When a symbol() has been set the symbol is used otherwise the column is displayed as plain rectangle using pen() and brush(). |
| Lines | Draw a simple line using the pen() for each interval. |
| UserStyle | Styles >= UserStyle are reserved for derived classes that overload drawSeries() with additional application specific ways to display a histogram. |
构造及析构函数说明
◆ QwtPlotHistogram()
|
explicit |
Constructor with QwtText title
- 参数
-
[in] title Title of the histogram
Constructor with QString title
- 参数
-
[in] title Title of the histogram
Destructor
成员函数说明
◆ attach()
|
overridevirtual |
Attach the histogram to a plot
If pen/brush have not been explicitly set by the user, the histogram automatically receives colors from the plot's color cycle.
- 参数
-
plot Plot to attach to (nullptr to detach)
重载 QwtPlotItem .
◆ baseline()
| double QwtPlotHistogram::baseline | ( | ) | const |
◆ boundingRect()
|
overridevirtual |
Get the bounding rectangle of all samples
- 返回
- Bounding rectangle of all samples. For an empty series the rectangle is invalid.
重载 QwtPlotSeriesItem .
◆ brush()
| const QBrush & QwtPlotHistogram::brush | ( | ) | const |
◆ columnRect()
|
protectedvirtual |
Get the column rectangle
Calculate the area that is covered by a sample
- 参数
-
sample Sample xMap Maps x-values into pixel coordinates. yMap Maps y-values into pixel coordinates.
- 返回
- Rectangle, that is covered by a sample
◆ drawColumn()
|
protectedvirtual |
Draw a column
Draw a column for a sample in Columns style().
When a symbol() has been set the symbol is used otherwise the column is displayed as plain rectangle using pen() and brush().
- 参数
-
painter Painter rect Rectangle where to paint the column in paint device coordinates sample Sample to be displayed
- 注解
- In applications, where different intervals need to be displayed in a different way ( f.e different colors or even using different symbols) it is recommended to overload drawColumn().
◆ drawColumns()
|
protected |
Draw columns
Draw a histogram in Columns style()
- 参数
-
painter Painter xMap Maps x-values into pixel coordinates. yMap Maps y-values into pixel coordinates. from Index of the first sample to be painted to Index of the last sample to be painted. If to < 0 the histogram will be painted to its last point.
◆ drawLines()
|
protected |
Draw lines
Draw a histogram in Lines style()
- 参数
-
painter Painter xMap Maps x-values into pixel coordinates. yMap Maps y-values into pixel coordinates. from Index of the first sample to be painted to Index of the last sample to be painted. If to < 0 the histogram will be painted to its last point.
◆ drawOutline()
|
protected |
Draw outline
Draw a histogram in Outline style()
- 参数
-
painter Painter xMap Maps x-values into pixel coordinates. yMap Maps y-values into pixel coordinates. from Index of the first sample to be painted to Index of the last sample to be painted. If to < 0 the histogram will be painted to its last point.
- 警告
- The outline style requires, that the intervals are in increasing order and not overlapping.
◆ drawSeries()
|
overridevirtual |
Draw a subset of the histogram samples
- 参数
-
[in] painter Painter [in] xMap Maps x-values into pixel coordinates [in] yMap Maps y-values into pixel coordinates [in] canvasRect Contents rectangle of the canvas [in] from Index of the first sample to be painted [in] to Index of the last sample to be painted. If to < 0 the series will be painted to its last sample.
实现了 QwtPlotSeriesItem.
◆ legendIcon()
|
overridevirtual |
A plain rectangle without pen using the brush()
- 参数
-
index Index of the legend entry ( ignored as there is only one ) size Icon size
- 返回
- A graphic displaying the icon
重载 QwtPlotItem .
◆ pen()
| const QPen & QwtPlotHistogram::pen | ( | ) | const |
◆ rtti()
|
overridevirtual |
◆ setBaseline()
| void QwtPlotHistogram::setBaseline | ( | double | value | ) |
Set the value of the baseline
Each column representing an QwtIntervalSample is defined by its interval and the interval between baseline and the value of the sample. The default value of the baseline is 0.0.
- 参数
-
[in] value Value of the baseline
◆ setBrush()
| void QwtPlotHistogram::setBrush | ( | const QBrush & | brush | ) |
◆ setPen() [1/2]
| void QwtPlotHistogram::setPen | ( | const QColor & | color, |
| qreal | width = 0.0, |
||
| Qt::PenStyle | style = Qt::SolidLine |
||
| ) |
◆ setPen() [2/2]
| void QwtPlotHistogram::setPen | ( | const QPen & | pen | ) |
◆ setSamples() [1/2]
| void QwtPlotHistogram::setSamples | ( | const QVector< QwtIntervalSample > & | samples | ) |
Initialize data with an array of samples
- 参数
-
[in] samples Vector of points
◆ setSamples() [2/2]
| void QwtPlotHistogram::setSamples | ( | QwtSeriesData< QwtIntervalSample > * | data | ) |
Assign a series of samples
setSamples() is just a wrapper for setData() without any additional value - beside that it is easier to find for the developer.
- 参数
-
[in] data Data
- 警告
- The item takes ownership of the data object, deleting it when it's not used anymore.
◆ setStyle()
| void QwtPlotHistogram::setStyle | ( | HistogramStyle | style | ) |
◆ setSymbol()
| void QwtPlotHistogram::setSymbol | ( | const QwtColumnSymbol * | symbol | ) |
Assign a symbol
In Column style an optional symbol can be assigned, that is responsible for displaying the rectangle that is defined by the interval and the distance between baseline() and value. When no symbol has been defined the area is displayed as plain rectangle using pen() and brush().
- 注解
- In applications, where different intervals need to be displayed in a different way (e.g. different colors or even using different symbols) it is recommended to overload drawColumn().
- 参见
- style(), symbol(), drawColumn(), pen(), brush()
◆ style()
| QwtPlotHistogram::HistogramStyle QwtPlotHistogram::style | ( | ) | const |
◆ symbol()
| const QwtColumnSymbol * QwtPlotHistogram::symbol | ( | ) | const |
该类的文档由以下文件生成:
- /home/runner/work/QWT/QWT/src/plot/qwt_plot_histogram.h
- /home/runner/work/QWT/QWT/src/plot/qwt_plot_histogram.cpp