An item, which displays a spectrogram. More...
#include <qwt_polar_spectrogram.h>
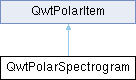
Classes | |
| class | PrivateData |
| class | TileInfo |
Public Types | |
| enum | PaintAttribute { ApproximatedAtan = 0x01 } |
| Attributes to modify the drawing algorithm. More... | |
 Public Types inherited from QwtPolarItem Public Types inherited from QwtPolarItem | |
| enum | RttiValues { Rtti_PolarItem = 0 , Rtti_PolarGrid , Rtti_PolarMarker , Rtti_PolarCurve , Rtti_PolarSpectrogram , Rtti_PolarUserItem = 1000 } |
| Runtime type information. More... | |
| enum | ItemAttribute { Legend = 0x01 , AutoScale = 0x02 } |
| Plot Item Attributes. More... | |
| enum | RenderHint { RenderAntialiased = 0x01 } |
| Render hints. More... | |
Public Member Functions | |
| QwtPolarSpectrogram () | |
| Constructor. | |
| ~QwtPolarSpectrogram () override | |
| Destructor. | |
| void | setData (QwtRasterData *data) |
| Set the data. | |
| const QwtRasterData * | data () const |
| Get the data. | |
| void | setColorMap (QwtColorMap *) |
| Set the color map. | |
| const QwtColorMap * | colorMap () const |
| Get the color map. | |
| void | setPaintAttribute (PaintAttribute, bool on=true) |
| Set a paint attribute. | |
| bool | testPaintAttribute (PaintAttribute) const |
| Test a paint attribute. | |
| virtual int | rtti () const override |
| Get the runtime type information. | |
| virtual void | draw (QPainter *painter, const QwtScaleMap &azimuthMap, const QwtScaleMap &radialMap, const QPointF &pole, double radius, const QRectF &canvasRect) const override |
| Draw the spectrogram. | |
| virtual QwtInterval | boundingInterval (int scaleId) const override |
| Get the bounding interval for a scale. | |
| Public Member Functions inherited from QwtPolarItem | |
| QwtPolarItem (const QwtText &title=QwtText()) | |
| Constructor. | |
| virtual | ~QwtPolarItem () |
| Destructor. | |
| void | attach (QwtPolarPlot *plot) |
| Attach the item to a plot. | |
| void | detach () |
| Detach the item from its plot. | |
| QwtPolarPlot * | plot () const |
| Get the attached plot. | |
| void | setTitle (const QString &title) |
| Set the title from a QString. | |
| void | setTitle (const QwtText &title) |
| Set the title from a QwtText. | |
| const QwtText & | title () const |
| Get the title. | |
| void | setItemAttribute (ItemAttribute, bool on=true) |
| Set an item attribute. | |
| bool | testItemAttribute (ItemAttribute) const |
| Test an item attribute. | |
| void | setRenderHint (RenderHint, bool on=true) |
| Set a render hint. | |
| bool | testRenderHint (RenderHint) const |
| Test a render hint. | |
| void | setRenderThreadCount (uint numThreads) |
| Set the number of render threads. | |
| uint | renderThreadCount () const |
| Get the number of render threads. | |
| double | z () const |
| Get the z value. | |
| void | setZ (double z) |
| Set the z value. | |
| void | show () |
| Show the item. | |
| void | hide () |
| Hide the item. | |
| virtual void | setVisible (bool) |
| Set the visibility. | |
| bool | isVisible () const |
| Get the visibility. | |
| virtual void | itemChanged () |
| Update the item and trigger autoRefresh. | |
| virtual void | legendChanged () |
| Update the legend. | |
| virtual void | updateScaleDiv (const QwtScaleDiv &, const QwtScaleDiv &, const QwtInterval &) |
| Update the scale division. | |
| virtual int | marginHint () const |
| Get the margin hint. | |
| void | setLegendIconSize (const QSize &) |
| Set the legend icon size. | |
| QSize | legendIconSize () const |
| Get the legend icon size. | |
| virtual QList< QwtLegendData > | legendData () const |
| Get the legend data. | |
| virtual QwtGraphic | legendIcon (int index, const QSizeF &) const |
| Get the legend icon. | |
Protected Member Functions | |
| virtual QImage | renderImage (const QwtScaleMap &azimuthMap, const QwtScaleMap &radialMap, const QPointF &pole, const QRect &rect) const |
| Render an image. | |
| virtual void | renderTile (const QwtScaleMap &azimuthMap, const QwtScaleMap &radialMap, const QPointF &pole, const QPoint &imagePos, const QRect &tile, QImage *image) const |
| Render a tile. | |
Detailed Description
An item, which displays a spectrogram.
A spectrogram displays 3-dimensional data, where the 3rd dimension ( the intensity ) is displayed using colors. The colors are calculated from the values using a color map.
- See also
- QwtRasterData, QwtColorMap
Member Enumeration Documentation
◆ PaintAttribute
Attributes to modify the drawing algorithm.
The default setting disables ApproximatedAtan
- See also
- setPaintAttribute(), testPaintAttribute()
| Enumerator | |
|---|---|
| ApproximatedAtan | Use qwtFastAtan2 instead of atan2 for translating widget into polar coordinates. |
Constructor & Destructor Documentation
◆ QwtPolarSpectrogram()
|
explicit |
Constructor.
Creates a spectrogram item with default settings.
Destructor
Member Function Documentation
◆ boundingInterval()
|
overridevirtual |
Get the bounding interval for a scale.
This interval can be useful for operations like clipping or autoscaling.
- Parameters
-
scaleId Scale index
- Returns
- Bounding interval ( == position )
- See also
- position()
Reimplemented from QwtPolarItem.
◆ colorMap()
| const QwtColorMap * QwtPolarSpectrogram::colorMap | ( | ) | const |
Get the color map.
Get the color map used for mapping intensity values to colors.
- Returns
- Color Map
- See also
- setColorMap()
◆ data()
| const QwtRasterData * QwtPolarSpectrogram::data | ( | ) | const |
◆ draw()
|
overridevirtual |
Draw the spectrogram.
- Parameters
-
painter Painter azimuthMap Maps azimuth values to values related to 0.0, M_2PI radialMap Maps radius values into painter coordinates pole Position of the pole in painter coordinates radius Radius of the complete plot area in painter coordinates canvasRect Contents rect of the canvas in painter coordinates
Implements QwtPolarItem.
◆ renderImage()
|
protectedvirtual |
Render an image.
Render an image from the data and color map.
The area is translated into a rect of the paint device. For each pixel of this rect the intensity is mapped into a color.
- Parameters
-
azimuthMap Maps azimuth values to values related to 0.0, M_2PI radialMap Maps radius values into painter coordinates. pole Position of the pole in painter coordinates rect Target rectangle of the image in painter coordinates
- Returns
- A QImage::Format_Indexed8 or QImage::Format_ARGB32 depending on the color map.
- See also
- QwtRasterData::intensity(), QwtColorMap::rgb(), QwtColorMap::colorIndex()
◆ renderTile()
|
protectedvirtual |
Render a tile.
Render a sub-rectangle of an image.
renderTile() is called by renderImage() to render different parts of the image by concurrent threads.
- Parameters
-
azimuthMap Maps azimuth values to values related to 0.0, M_2PI radialMap Maps radius values into painter coordinates. pole Position of the pole in painter coordinates imagePos Top/left position of the image in painter coordinates tile Sub-rectangle of the tile in painter coordinates image Image to be rendered
- See also
- setRenderThreadCount()
- Note
- renderTile needs to be reentrant
◆ rtti()
|
overridevirtual |
◆ setColorMap()
| void QwtPolarSpectrogram::setColorMap | ( | QwtColorMap * | colorMap | ) |
Set the color map.
Change the color map.
Often it is useful to display the mapping between intensities and colors as an additional plot axis, showing a color bar.
- Parameters
-
colorMap Color Map
◆ setData()
| void QwtPolarSpectrogram::setData | ( | QwtRasterData * | data | ) |
Set the data.
Set the data to be displayed.
- Parameters
-
data Spectrogram Data
- See also
- data()
- Warning
- QwtRasterData::initRaster() is called each time before the image is rendered, but without any useful parameters. Also QwtRasterData::rasterHint() is not used.
◆ setPaintAttribute()
| void QwtPolarSpectrogram::setPaintAttribute | ( | PaintAttribute | attribute, |
| bool | on = true |
||
| ) |
Set a paint attribute.
Specify an attribute how to draw the curve.
- Parameters
-
attribute Paint attribute on On/Off
- See also
- testPaintAttribute()
◆ testPaintAttribute()
| bool QwtPolarSpectrogram::testPaintAttribute | ( | PaintAttribute | attribute | ) | const |
Test a paint attribute.
- Parameters
-
attribute Paint attribute
- Returns
- True when attribute has been set
- See also
- setPaintAttribute()
The documentation for this class was generated from the following files:
- /home/runner/work/QWT/QWT/src/plot/qwt_polar_spectrogram.h
- /home/runner/work/QWT/QWT/src/plot/qwt_polar_spectrogram.cpp