Layout engine for QwtPlot. More...
#include <qwt_plot_layout.h>
Classes | |
| class | PrivateData |
Public Types | |
| enum | Option { AlignScales = 0x01 , IgnoreScrollbars = 0x02 , IgnoreFrames = 0x04 , IgnoreLegend = 0x08 , IgnoreTitle = 0x10 , IgnoreFooter = 0x20 } |
| Options to configure the plot layout engine. More... | |
Public Member Functions | |
| QwtPlotLayout () | |
| Constructor. | |
| void | setCanvasMargin (int margin, int axis=-1) |
| Set the canvas margin for a specific axis position. | |
| int | canvasMargin (int axisId) const |
| Get the canvas margin for a specific axis position. | |
| void | setAlignCanvasToScales (bool) |
| Set the align-canvas-to-axis-scales flag for all axes. | |
| void | setAlignCanvasToScale (int axisId, bool) |
| Set the align-canvas-to-axis-scales setting for a specific axis. | |
| bool | alignCanvasToScale (int axisId) const |
| Get the align-canvas-to-axis-scales setting for a specific axis. | |
| void | setFixedCanvasSize (int axisPos, bool on) |
| Enable fixed canvas size for an axis direction. | |
| bool | isFixedCanvasSize (int axisPos) const |
| Check if fixed canvas size is enabled for a given axis position. | |
| void | setFixedCanvasSize (const QSize &size) |
| Set a manual fixed canvas size, overriding the auto-captured value. | |
| QSize | fixedCanvasSize () const |
| Get the manual fixed canvas size. | |
| void | resetFixedCanvasSize () |
| Clear all locked canvas sizes. | |
| void | setSpacing (int) |
| Set the spacing between plot components. | |
| int | spacing () const |
| Get the spacing between plot components. | |
| void | setLegendPosition (QwtPlot::LegendPosition pos, double ratio) |
| Set the legend position with a specified ratio. | |
| void | setLegendPosition (QwtPlot::LegendPosition pos) |
| Set the legend position. | |
| QwtPlot::LegendPosition | legendPosition () const |
| Get the legend position. | |
| void | setLegendRatio (double ratio) |
| Set the relative size of the legend in the plot. | |
| double | legendRatio () const |
| Get the relative size of the legend in the plot. | |
| virtual QSize | minimumSizeHint (const QwtPlot *) const |
| Calculate the minimum size hint for the plot. | |
| virtual void | activate (const QwtPlot *plot, const QRectF &plotRect, Options options=Options()) |
| Recalculate the geometry of all plot components. | |
| virtual void | invalidate () |
| Invalidate the geometry of all components. | |
| QRectF | titleRect () const |
| Get the geometry for the title. | |
| QRectF | footerRect () const |
| Get the geometry for the footer. | |
| QRectF | legendRect () const |
| Get the geometry for the legend. | |
| QRectF | scaleRect (QwtAxisId) const |
| Get the geometry for a scale axis. | |
| QRectF | scaleCaptionRect (QwtAxisId) const |
| Get the geometry of the caption strip for an outside axis title. | |
| QRectF | canvasRect () const |
| Get the geometry for the canvas. | |
Protected Member Functions | |
| void | setTitleRect (const QRectF &) |
| Set the geometry for the title. | |
| void | setFooterRect (const QRectF &) |
| Set the geometry for the footer. | |
| void | setLegendRect (const QRectF &) |
| Set the geometry for the legend. | |
| void | setScaleRect (QwtAxisId, const QRectF &) |
| Set the geometry for an axis. | |
| void | setScaleCaptionRect (QwtAxisId, const QRectF &) |
| Set the geometry of the caption strip for an outside axis title. | |
| void | updateScaleCaptionRects (const QwtPlot *plot) |
| Recompute all caption rects from the current scale rects. | |
| void | setCanvasRect (const QRectF &) |
| Set the geometry for the canvas. | |
| QwtPlotLayoutEngine * | layoutEngine () |
| void | doActivate (const QwtPlot *plot, const QRectF &plotRect, Options options=Options()) |
| Concrete implementation of QwtPlotLayout::activate. | |
Detailed Description
Layout engine for QwtPlot.
It is used by the QwtPlot widget to organize its internal widgets or by QwtPlot::print() to render its content to a QPaintDevice like a QPrinter, QPixmap/QImage or QSvgRenderer.
- See also
- QwtPlot::setPlotLayout()
Member Enumeration Documentation
◆ Option
Options to configure the plot layout engine.
- See also
- activate(), QwtPlotRenderer
Constructor & Destructor Documentation
◆ QwtPlotLayout()
|
explicit |
Constructor.
Creates a new QwtPlotLayout instance with default settings. The legend position is set to BottomLegend and canvas margin is set to -1.
Destructor
Destroys the QwtPlotLayout instance and releases all allocated resources.
Member Function Documentation
◆ activate()
|
virtual |
Recalculate the geometry of all plot components.
- Parameters
-
plot The plot widget to layout plotRect The rectangle where to place the components (in pixels) options Layout options (e.g., ignore legend, ignore specific axes)
Calculates and stores the geometry for all sub-components (title, footer, legend, 4 axes, and canvas). Results are stored internally and can be retrieved via titleRect(), footerRect(), legendRect(), canvasRect(), and scaleRect().
- See also
- invalidate(), titleRect(), footerRect(), legendRect(), scaleRect(), canvasRect()
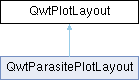
Reimplemented in QwtParasitePlotLayout.
◆ alignCanvasToScale()
| bool QwtPlotLayout::alignCanvasToScale | ( | int | axisPos | ) | const |
Get the align-canvas-to-axis-scales setting for a specific axis.
- Parameters
-
axisPos Axis position (QwtAxis::Position)
- Returns
- True if canvas is aligned to scale ends, false if it extends beyond
◆ canvasMargin()
| int QwtPlotLayout::canvasMargin | ( | int | axisPos | ) | const |
Get the canvas margin for a specific axis position.
- Parameters
-
axisPos Axis position (QwtAxis::Position)
- Returns
- The margin around the scale tick borders for the specified axis
- See also
- setCanvasMargin()
◆ canvasRect()
| QRectF QwtPlotLayout::canvasRect | ( | ) | const |
Get the geometry for the canvas.
- Returns
- The canvas rectangle
- See also
- activate(), invalidate(), setCanvasRect()
◆ doActivate()
|
protected |
Concrete implementation of QwtPlotLayout::activate.
- Parameters
-
plotRect options
◆ fixedCanvasSize()
| QSize QwtPlotLayout::fixedCanvasSize | ( | ) | const |
Get the manual fixed canvas size.
- Returns
- Manual canvas size; a component < 0 means auto-capture for that direction
- See also
- setFixedCanvasSize(QSize)
◆ footerRect()
| QRectF QwtPlotLayout::footerRect | ( | ) | const |
Get the geometry for the footer.
- Returns
- The footer rectangle
- See also
- activate(), invalidate(), setFooterRect()
◆ invalidate()
|
virtual |
Invalidate the geometry of all components.
Resets all geometry rectangles (title, footer, legend, canvas, and scales) to empty rectangles. Must call activate() to recalculate geometries.
- See also
- activate()
◆ isFixedCanvasSize()
| bool QwtPlotLayout::isFixedCanvasSize | ( | int | axisPos | ) | const |
Check if fixed canvas size is enabled for a given axis position.
- Parameters
-
axisPos Axis position (QwtAxis::Position)
- Returns
- True if fixed canvas size is enabled for this axis direction
- See also
- setFixedCanvasSize(int, bool)
◆ legendPosition()
| QwtPlot::LegendPosition QwtPlotLayout::legendPosition | ( | ) | const |
Get the legend position.
- Returns
- The current legend position
- See also
- setLegendPosition(), QwtPlot::setLegendPosition(), QwtPlot::legendPosition()
◆ legendRatio()
| double QwtPlotLayout::legendRatio | ( | ) | const |
Get the relative size of the legend in the plot.
- Returns
- The legend ratio value
- See also
- setLegendRatio(), setLegendPosition()
◆ legendRect()
| QRectF QwtPlotLayout::legendRect | ( | ) | const |
Get the geometry for the legend.
- Returns
- The legend rectangle
- See also
- activate(), invalidate(), setLegendRect()
◆ minimumSizeHint()
|
virtual |
Calculate the minimum size hint for the plot.
- Parameters
-
plot The plot widget to calculate size hint for
- Returns
- The minimum size hint
- See also
- QwtPlot::minimumSizeHint()
Reimplemented in QwtParasitePlotLayout.
◆ resetFixedCanvasSize()
| void QwtPlotLayout::resetFixedCanvasSize | ( | ) |
Clear all locked canvas sizes.
Clears both the auto-captured offsets and the manual override so the next activate() re-captures from the current layout. The enabled state of each axis direction (setFixedCanvasSize(int, bool)) is left unchanged.
- See also
- setFixedCanvasSize(int, bool), setFixedCanvasSize(QSize)
◆ scaleCaptionRect()
| QRectF QwtPlotLayout::scaleCaptionRect | ( | QwtAxisId | axisId | ) | const |
Get the geometry of the caption strip for an outside axis title.
The caption strip is reserved for axes whose scale widget has QwtScaleWidget::TitleOutside placement: below the scale rect for YLeft/YRight/XBottom, above it for XTop. Captions of Y axes are confined to the own column of their layer (the band minus the margin/edgeMargin offsets used by the parasite plot system).
- Parameters
-
axisId Axis identifier
- Returns
- The caption rectangle, empty if the axis has no outside title
◆ scaleRect()
| QRectF QwtPlotLayout::scaleRect | ( | QwtAxisId | axisId | ) | const |
Get the geometry for a scale axis.
- Parameters
-
axisId Axis identifier
- Returns
- The scale rectangle for the specified axis, or empty QRectF if invalid
- See also
- activate(), invalidate(), setScaleRect()
◆ setAlignCanvasToScale()
| void QwtPlotLayout::setAlignCanvasToScale | ( | int | axisPos, |
| bool | on | ||
| ) |
Set the align-canvas-to-axis-scales setting for a specific axis.
- Parameters
-
axisPos Axis position. This identifies a border of the plot. For example, QwtAxis::YLeft aligns the left end of X-axes. on True to align canvas to scales, false to extend beyond scale ends
The canvas may either extend beyond the axis scale ends to maximize its size, or align with the axis scale ends to control its size.
- Note
- When on is true, canvasMargin() has no effect
◆ setAlignCanvasToScales()
| void QwtPlotLayout::setAlignCanvasToScales | ( | bool | on | ) |
Set the align-canvas-to-axis-scales flag for all axes.
- Parameters
-
on True to align canvas to scales, false otherwise
◆ setCanvasMargin()
| void QwtPlotLayout::setCanvasMargin | ( | int | margin, |
| int | axisPos = -1 |
||
| ) |
Set the canvas margin for a specific axis position.
- Parameters
-
margin The margin value. A negative margin (-1) excludes scale borders. Positive values add space between scale ticks and canvas edge. 0 means tight against tick marks. axisPos Axis position (QwtAxis::Position). Use -1 to apply to all axes.
The margin is the space above/below the scale ticks. When alignCanvasToScale() is true, the margin has no effect.
- See also
- canvasMargin(), setAlignCanvasToScale()
◆ setCanvasRect()
|
protected |
Set the geometry for the canvas.
This method is intended to be used from derived layouts overloading activate()
- See also
- canvasRect(), activate()
◆ setFixedCanvasSize() [1/2]
| void QwtPlotLayout::setFixedCanvasSize | ( | const QSize & | size | ) |
Set a manual fixed canvas size, overriding the auto-captured value.
- Parameters
-
size Manual canvas size. A component < 0 means "use auto-capture" for that direction (requires setFixedCanvasSize(axisPos, true)).
When a component is >= 0, the canvas is pinned to that exact dimension and centered along it; otherwise the auto-captured offsets are used.
◆ setFixedCanvasSize() [2/2]
| void QwtPlotLayout::setFixedCanvasSize | ( | int | axisPos, |
| bool | on | ||
| ) |
Enable fixed canvas size for an axis direction.
- Parameters
-
axisPos Axis position. YLeft/YRight fix the canvas width; XBottom/XTop fix the canvas height. on True to hold the canvas dimension stable against axis label growth.
When enabled, the canvas dimension is captured on the next activate() and held stable; overflowing axis labels are clipped by the scale widget's paint region. The captured value persists across layouts until resetFixedCanvasSize() is called.
- See also
- isFixedCanvasSize(), setFixedCanvasSize(QSize), resetFixedCanvasSize()
◆ setFooterRect()
|
protected |
Set the geometry for the footer.
This method is intended to be used from derived layouts overloading activate()
- See also
- footerRect(), activate()
◆ setLegendPosition() [1/2]
| void QwtPlotLayout::setLegendPosition | ( | QwtPlot::LegendPosition | pos | ) |
Set the legend position.
- Parameters
-
pos The legend position. Valid values are QwtPlot::LeftLegend, QwtPlot::RightLegend, QwtPlot::TopLegend, QwtPlot::BottomLegend.
- See also
- legendPosition(), QwtPlot::setLegendPosition()
◆ setLegendPosition() [2/2]
| void QwtPlotLayout::setLegendPosition | ( | QwtPlot::LegendPosition | pos, |
| double | ratio | ||
| ) |
Set the legend position with a specified ratio.
- Parameters
-
pos The legend position (LeftLegend, RightLegend, TopLegend, BottomLegend) ratio Ratio between legend and the bounding rectangle of title, footer, canvas and axes. Limited to (0.0, 1.0]. Values <= 0.0 use defaults. Default vertical/horizontal ratio is 0.33/0.5.
- See also
- legendPosition(), setLegendRatio(), QwtPlot::setLegendPosition()
◆ setLegendRatio()
| void QwtPlotLayout::setLegendRatio | ( | double | ratio | ) |
Set the relative size of the legend in the plot.
- Parameters
-
ratio Ratio between legend and the bounding rectangle of title, footer, canvas and axes. Limited to (0.0, 1.0]. Values <= 0.0 use defaults. Default vertical/horizontal ratio is 0.33/0.5.
- See also
- legendRatio(), setLegendPosition()
◆ setLegendRect()
|
protected |
Set the geometry for the legend.
This method is intended to be used from derived layouts overloading activate()
- Parameters
-
rect Rectangle for the legend
- See also
- legendRect(), activate()
◆ setScaleCaptionRect()
|
protected |
Set the geometry of the caption strip for an outside axis title.
This method is intended to be used from derived layouts overloading activate()
- Parameters
-
axisId Axis rect Rectangle for the caption strip
◆ setScaleRect()
|
protected |
Set the geometry for an axis.
This method is intended to be used from derived layouts overloading activate()
- Parameters
-
axisId Axis rect Rectangle for the scale
- See also
- scaleRect(), activate()
◆ setSpacing()
| void QwtPlotLayout::setSpacing | ( | int | spacing | ) |
Set the spacing between plot components.
- Parameters
-
spacing The spacing value in pixels. Must be >= 0.
- See also
- spacing(), setCanvasMargin()
◆ setTitleRect()
|
protected |
Set the geometry for the title.
This method is intended to be used from derived layouts overloading activate()
- See also
- titleRect(), activate()
◆ spacing()
| int QwtPlotLayout::spacing | ( | ) | const |
Get the spacing between plot components.
- Returns
- The spacing value in pixels
- See also
- setSpacing(), canvasMargin()
◆ titleRect()
| QRectF QwtPlotLayout::titleRect | ( | ) | const |
Get the geometry for the title.
- Returns
- The title rectangle
- See also
- activate(), invalidate(), setTitleRect()
◆ updateScaleCaptionRects()
|
protected |
Recompute all caption rects from the current scale rects.
For every visible axis whose scale widget has QwtScaleWidget::TitleOutside placement and a non-empty title, the caption strip adjacent to the scale rect is computed. Called at the end of doActivate(); derived layouts that replace the scale rects afterwards (like QwtParasitePlotLayout copying the rects from the host) have to call it again.
Captions of Y axes are painted below the scale widgets. All layers of a multi axis plot (host + parasites) share the bottom band, so the band is split between the captions of the visible layers: every caption gets the region between the mid points of the neighboring caption columns (the outermost captions extend to the plot border). This keeps the captions overlap free while giving them more width than the own column.
- Parameters
-
plot The plot owning the scale widgets
- See also
- scaleCaptionRect(), setScaleCaptionRect()
The documentation for this class was generated from the following files:
- /home/runner/work/QWT/QWT/src/plot/qwt_plot_layout.h
- /home/runner/work/QWT/QWT/src/plot/qwt_plot_layout.cpp